The Uncertainty Analysis page allows you to configure probability exceedance values (P-values) and uncertainty input parameters for generating probabilistic energy estimates. This page is accessed via the “Show Uncertainty Analysis” button on the Simulation Settings page.
Overview
The Uncertainty Analysis page is organized into the following sections:
- P-Value Selection — Choose which probability exceedance values to calculate (P99, P95, P90, P75, P10) plus a custom P-value option.
- Probability Distribution Chart — Visual representation of the GHI probability distribution with selected P-values marked.
- Uncertainty Inputs — Define the uncertainty percentages for various input parameters that contribute to the combined uncertainty.
| # | Input | Type | Units | Description | Related Documentation |
|---|
| 1 | P 99 | Checkbox | — | Include P99 in results. P99 represents the energy value exceeded with 99% probability — a conservative estimate for financing scenarios. | Uncertainty Analysis |
| 2 | P 95 | Checkbox | — | Include P95 in results. P95 represents the energy value exceeded with 95% probability. | Uncertainty Analysis |
| 3 | P 90 | Checkbox | — | Include P90 in results. P90 represents the energy value exceeded with 90% probability — commonly used for debt sizing in project finance. | Uncertainty Analysis |
| 4 | P 75 | Checkbox | — | Include P75 in results. P75 represents the energy value exceeded with 75% probability. | Uncertainty Analysis |
| 5 | P 10 | Checkbox | — | Include P10 in results. P10 represents the energy value exceeded with 10% probability — an optimistic upside estimate. | Uncertainty Analysis |
| 6 | Custom P (Checkbox) | Checkbox | — | Enable a custom probability exceedance value. When checked, enter the desired P-value in the adjacent text field. | — |
| 7 | Custom P (Value) | Text Field | — | Enter a custom probability exceedance percentage (1-99). The corresponding energy value will be calculated and included in results. | — |
A maximum of four (4) P-values can be selected simultaneously. P50 is always calculated and shown as the base case (50% probability of exceedance).
| # | Input | Type | Units | Description | Related Documentation |
|---|
| 8 | Spatial Variability | Text Field | % | Uncertainty due to differences between the weather data source location and the actual project site. Accounts for micro-climate variations and distance from measurement stations. | Uncertainty Analysis |
| 9 | Modeling Accuracy | Text Field | % | Uncertainty in the energy prediction model itself, including transposition, module performance, inverter efficiency, and loss calculations. | Uncertainty Analysis |
| 10 | Interannual Variability | Text Field | % | Year-to-year variation in solar resource at the site. Represents the natural fluctuation in annual irradiance from typical meteorological conditions. | Uncertainty Analysis |
| 11 | Irradiance Measurement Accuracy | Text Field | % | Uncertainty in the source irradiance data, including sensor calibration, data processing, and satellite-derived irradiance model accuracy. | Uncertainty Analysis |
| 12 | Monitoring Period Representativeness | Text Field | % | Uncertainty in how representative the weather data period is of long-term conditions. Shorter monitoring periods have higher uncertainty. | Uncertainty Analysis |
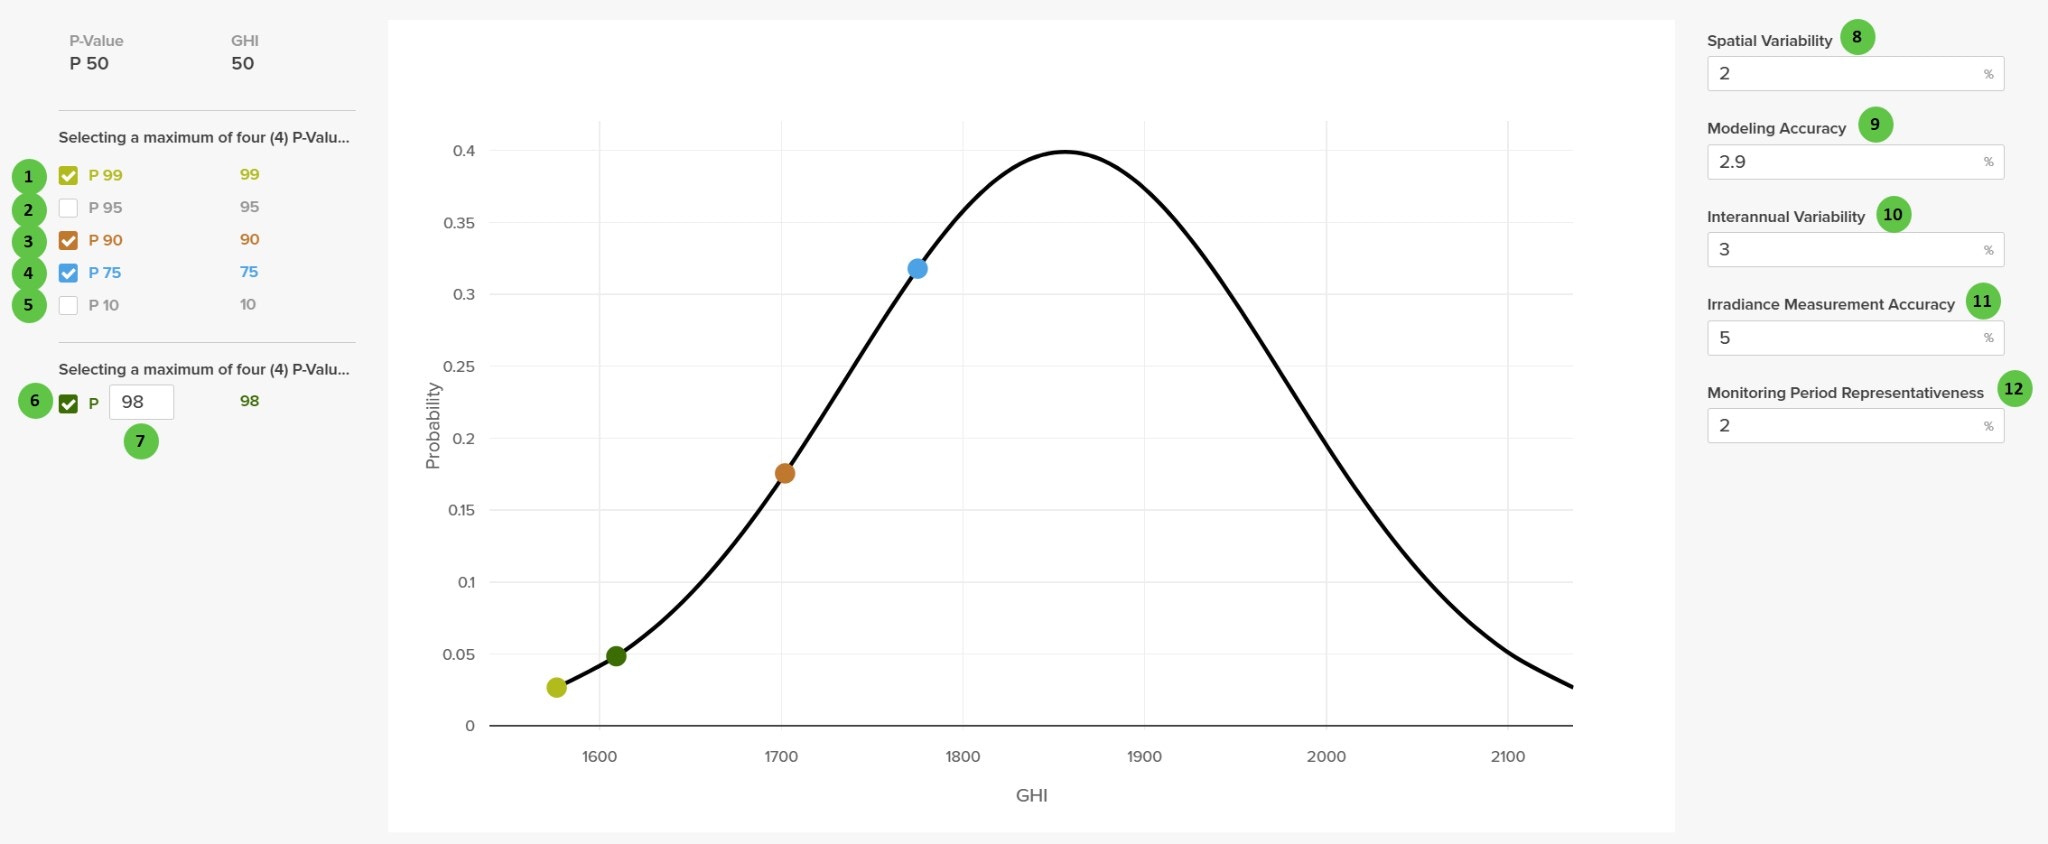
Probability Distribution Chart
The center panel displays a probability distribution curve showing the relationship between GHI values (X-axis) and probability density (Y-axis). Selected P-values are marked on the curve with colored dots, allowing visual comparison of exceedance thresholds.
Returning to Simulation Settings
After configuring uncertainty parameters, click outside the uncertainty panel or use the navigation to return to the Simulation Settings page. Uncertainty settings are saved automatically.