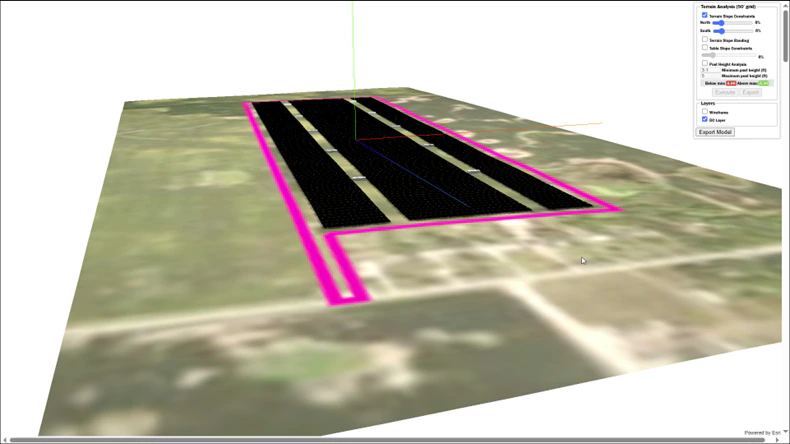
- Lay out the site in Power Plant Builder (On Map) using 0° tilt so the geometry fits the site boundary correctly.
- Clone the prediction and convert it to Power Plant Builder (By Block) to apply a slight East/West tilt and run an energy prediction that reflects the actual module orientation.
Reference and Setup
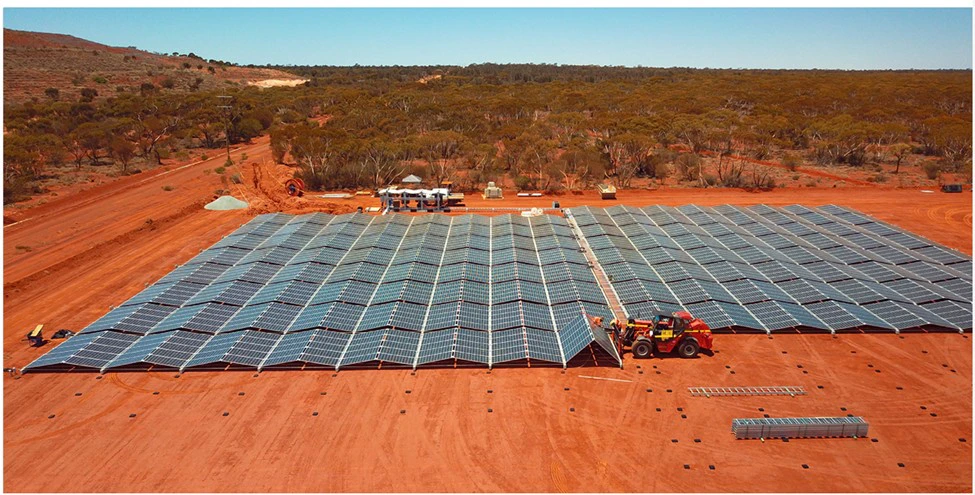
When designing an East-West dual tilt system, it helps to have a datasheet from your racking provider so you know how the table spacing works and what the dimensions of the table are. This example uses the 5B Maverick data sheet (available from 5B). Two key points from the datasheet:- East-West tables come in a 2 Modules High (E–W) by 5 Modules Wide (N–S) configuration.
- There is a gap between the tables in the North–South direction of approximately 2 ft.
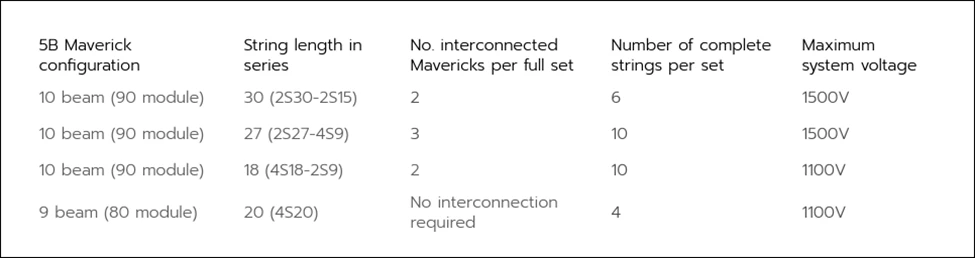
- The Maverick comes in either a 10 beam (90 module) or a 9 beam (80 module) configuration. This example uses the 10 beam (90 module), 30 module string length configuration.
Step 1 — Create the Layout in MapBuilder
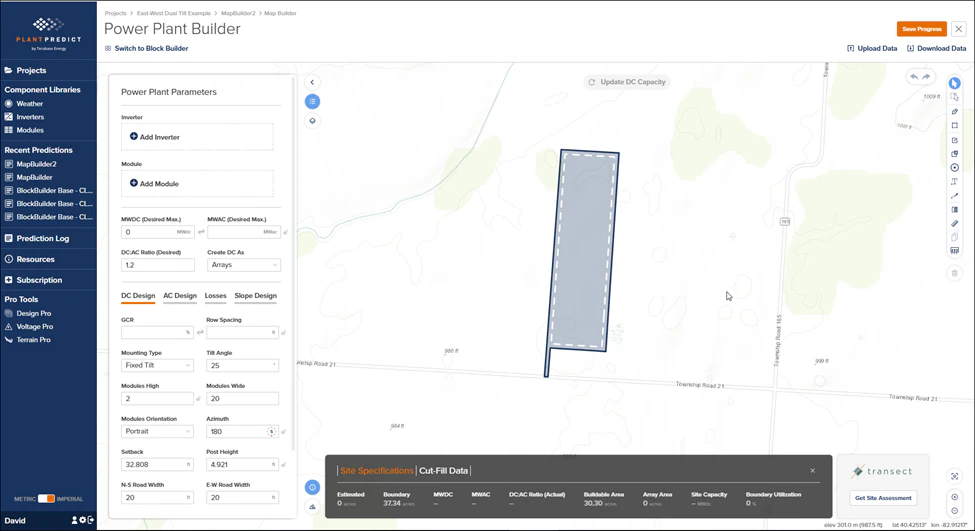
With the racking parameters in mind, start by creating a Project and a MapBuilder (“Build on the Map”) Prediction.Define the project and site boundary
Open the PV Blocks & Arrays section of the prediction and define the site boundary. The example site shown below is located in Ohio.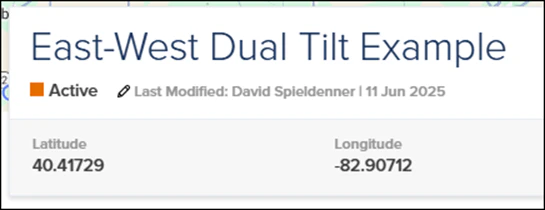
Set up the inverter and module
Select the inverter and module for the design: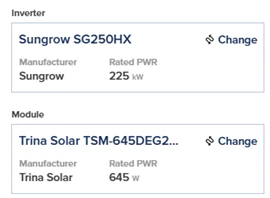
- Inverter: Sungrow SG250HX string inverter
- Module: Trina TSM-645DEG21C.20
Enter the MapBuilder parameters
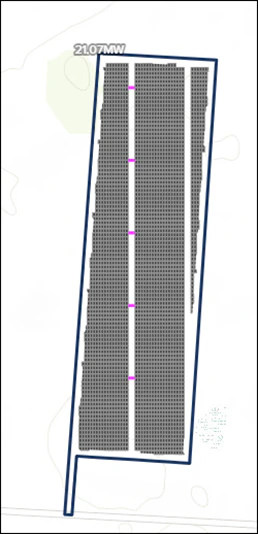
With a Desired DC Input of 100 MWDC (this site won’t fit 100 MWDC, but we want to max it out), set the following:
Click Update DC Capacity. The layout should look like the screenshot below.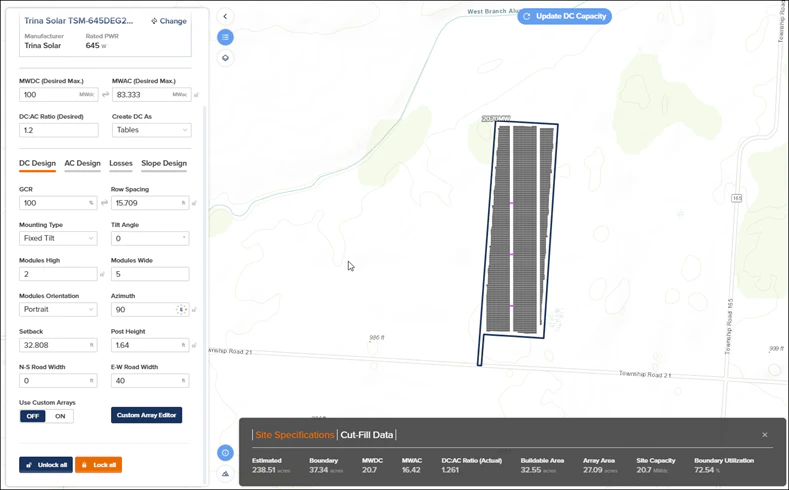
| Parameter | Value |
|---|---|
| Create DC as | Tables |
| GCR | 100 % |
| Tilt Angle | 0° |
| Modules High | 2 |
| Modules Wide | 5 |
| Azimuth | 90° |
| North–South Roads | 0 ft |
| East–West Roads | 40 ft |
Setting Tilt Angle = 0° is intentional. The modules will have a slight tilt in reality, but using 0° here produces the correct table footprint for laying out the site.
The road settings look counterintuitive: we actually want North–South access roads. However, because the array is rotated 90° by the azimuth setting, the East–West roads in the form will run North–South on the ground.
Step 2 — Tweak the Layout with the Custom Array Editor
The initial layout looks good but needs some minor tweaks.Enable custom arrays
Flip the Use Custom Arrays switch to On. This opens the Custom Array Editor.
Adjust tables and rows
Update the following values in the Custom Array Editor: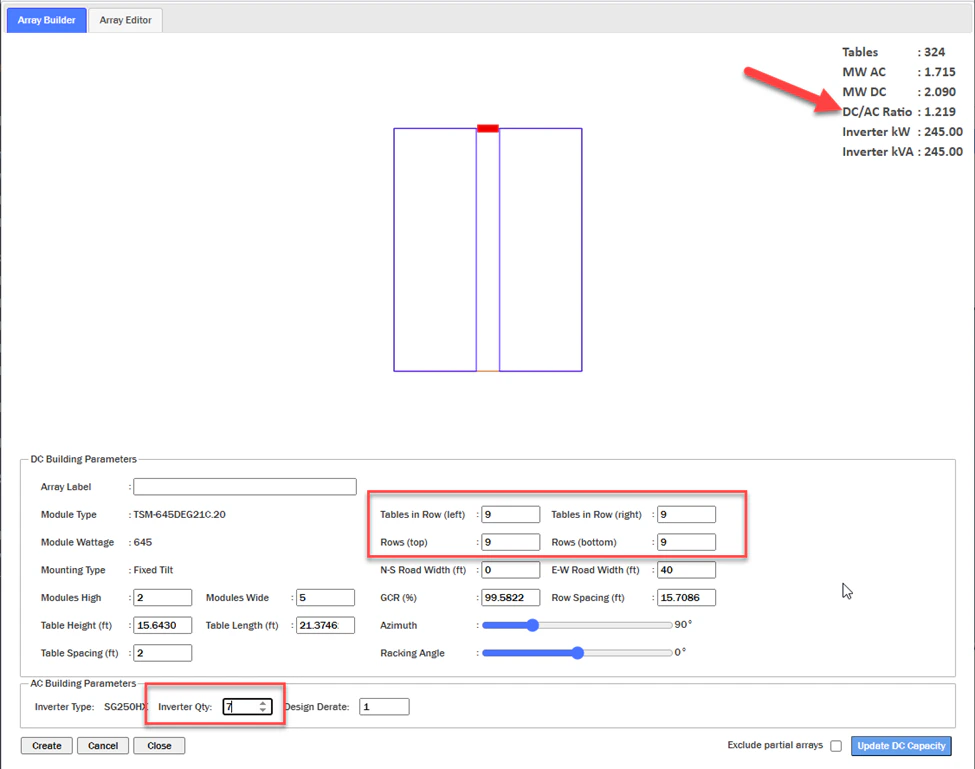
- Tables in Row (Left) = 9
- Tables in Row (Right) = 9
- Rows (Top) = 9
- Rows (Bottom) = 9
Adjust azimuth to align with the site boundary
Because the site is slightly askew, adjust the Azimuth to make the roads and tables align with the site boundary.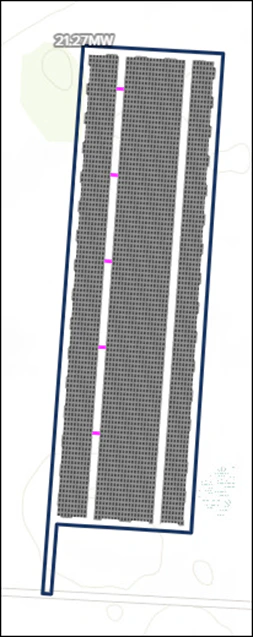
- In the Custom Array Editor, set Azimuth = 94°.
- Click Update DC Capacity.
Optional aesthetic clean-up
For aesthetic purposes, you can duplicate the Power Conversion Stations that are in the western access road and place them in the eastern access road.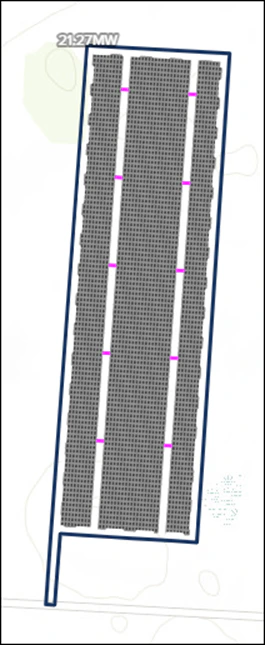
Step 3 — Run an Energy Prediction in Block Builder
You can use the MapBuilder design with 0° tilt to get a rough estimate of energy production. However, most East-West sites will have a slight East and West tilt, which increases overall energy production. To capture this, clone the MapBuilder prediction and convert it to a Block Builder prediction.Clone and convert to Block Builder
- Clone your MapBuilder prediction.
- Rename the cloned prediction so it is clear it is going to be a Block Builder prediction with a slight module slope.
- Open PV Blocks & Arrays and click the Convert to Block Builder button.
GCR note: The MapBuilder layout uses GCR = 100 % for layout generation. After converting to Block Builder and splitting the system into East-facing and West-facing DC Fields, set the GCR to 50 % for both DC Fields. Because the East and West sides are modeled separately in Block Builder, each field represents one side of the East-West table arrangement.
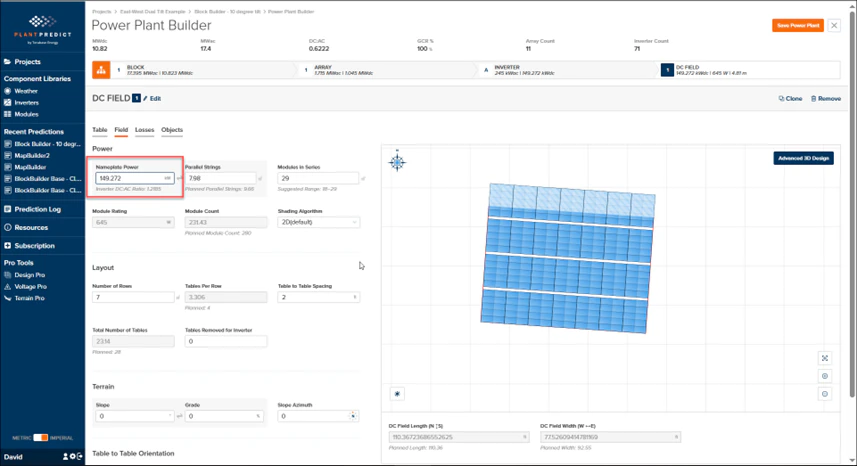
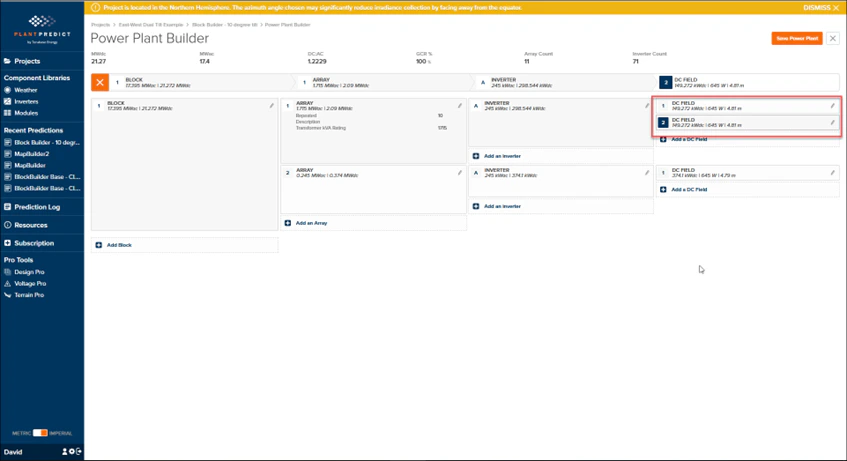
Split the DC Field
In the Electrical Configuration of the power plant, note the MWdc of the DC Field(s) and divide that number in half. You will create two DC Fields:
- One for the East-facing racks
- One for the West-facing racks
Configure the East-facing DC Field
On the Table tab of the East-facing DC Field, set: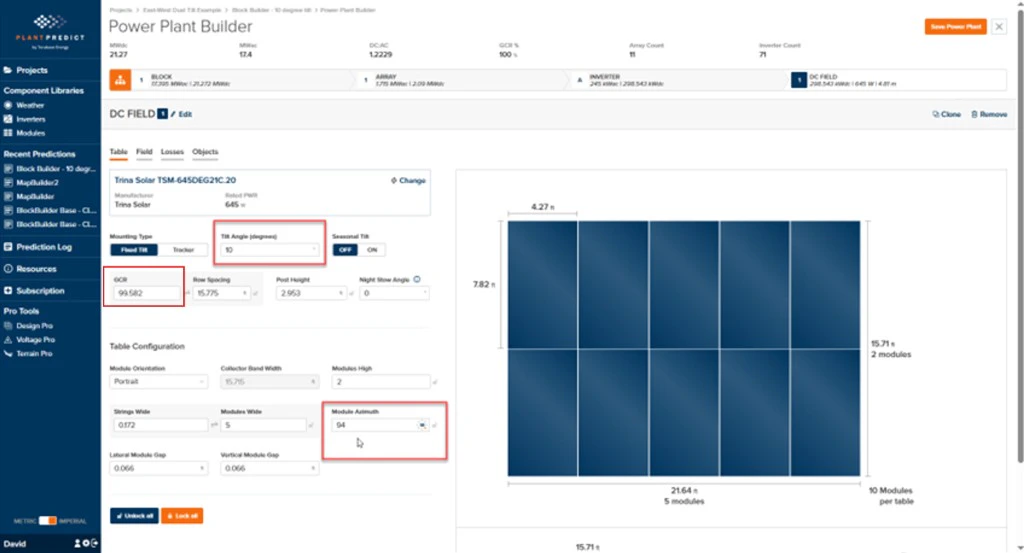
- Tilt Angle = 10°
- Azimuth = 94°
- GCR = 50 %
Clone and configure the West-facing DC Field
Click the Clone link to create the second DC Field. The cloned field retains the Tilt Angle = 10° and GCR = 50 % inputs from the East-facing DC Field.Set Azimuth = 94° + 180° = 274°.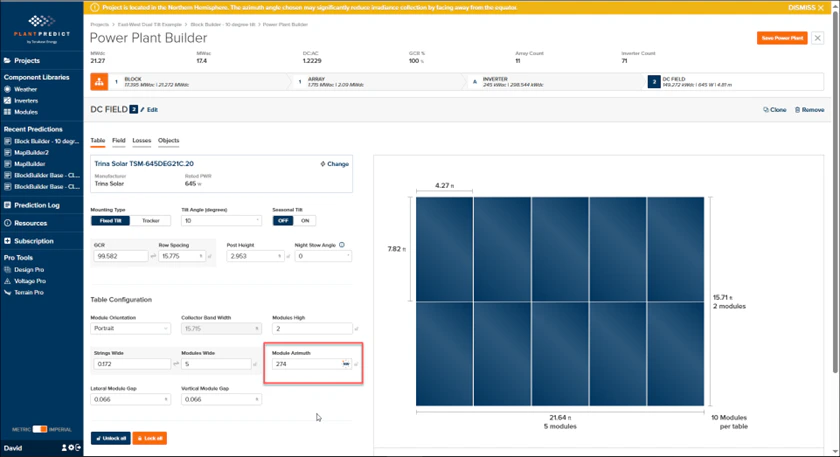
Step 4 — Run the Final Prediction
- Save the Power Plant.
- Run the Prediction.
- Go back to the Project and use Compare Multiple Results to see the difference between:
- The MapBuilder prediction (0° tilt)
- The Block Builder prediction (10° East-West tilt)
Comparing the two predictions quantifies the energy gain from modeling the actual East/West tilt versus the simplified 0° layout used for site planning.