Overview
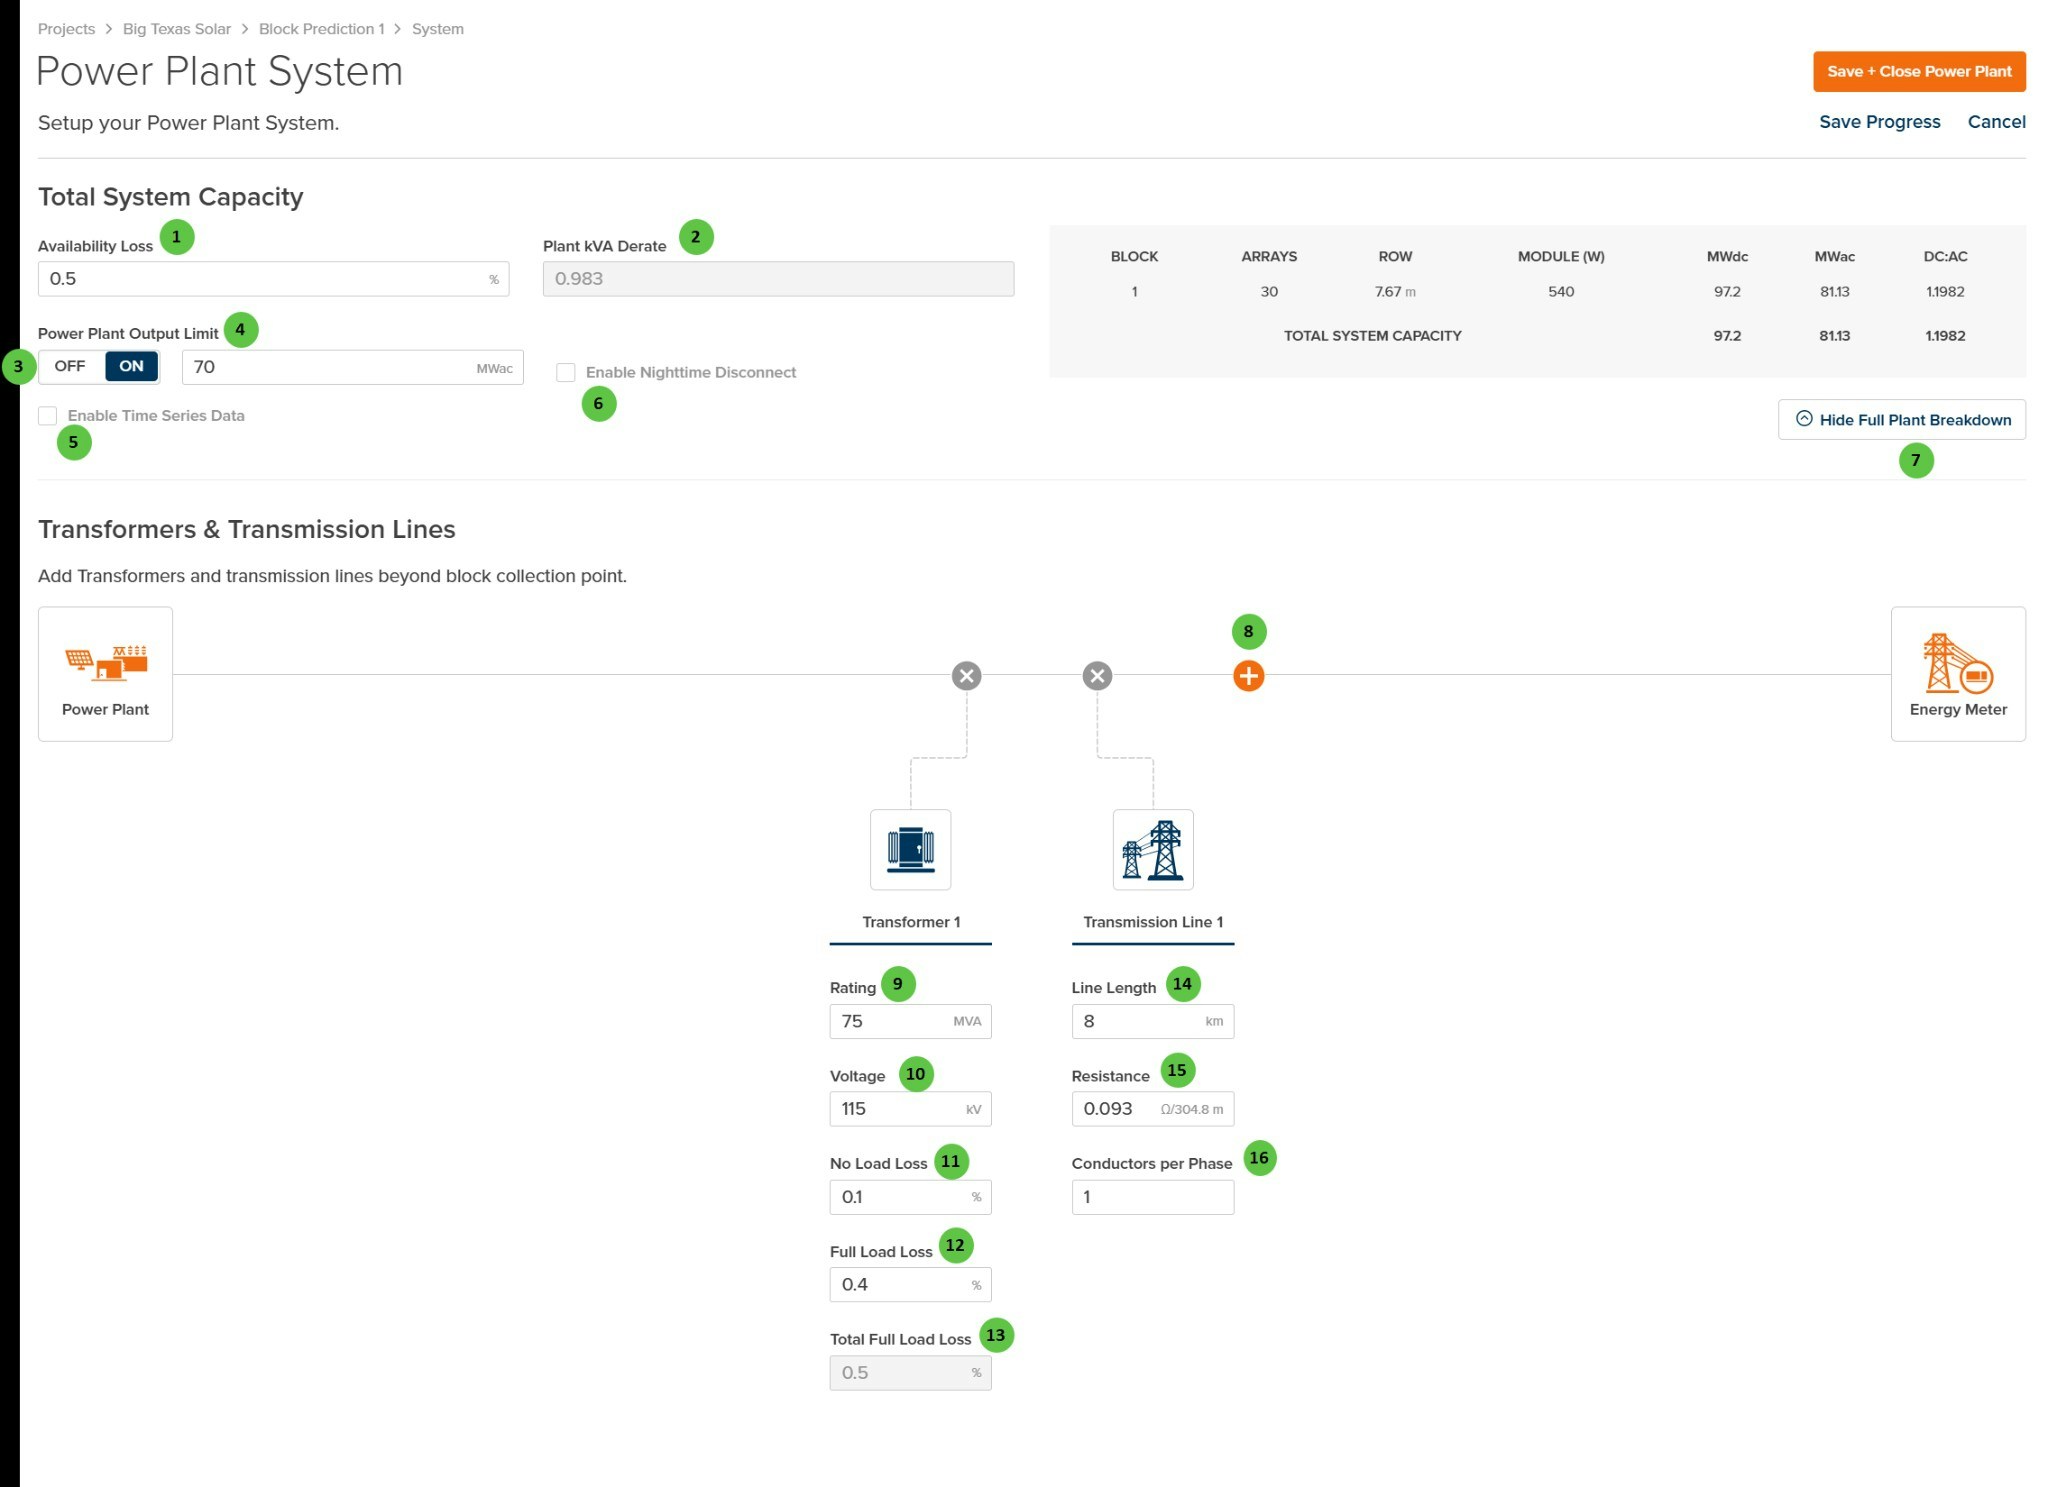
The System Details page is organized into the following sections:- Total System Capacity — Configure availability, plant kVA derate, output limits, and nighttime disconnect settings. A summary table displays the plant breakdown by Block.
- Transformers & Transmission Lines — Add and configure HV transformers and transmission lines between the plant and the energy meter to model interconnection losses.
User Inputs (Total System Capacity)
| # | Input | Type | Units | Description | Related Documentation |
|---|---|---|---|---|---|
| 1 | Availability Loss | Text Field | % | Percentage of time the plant is unavailable due to maintenance, outages, or grid curtailment. Applied as a flat reduction to annual energy production. | AC System Losses |
| 2 | Plant kVA Derate | Display | — | Cumulative inverter derate factor for the entire plant. This value is read-only and is calculated from the individual inverter derate values defined in the PV Blocks & Arrays section. | — |
| 3 | Power Plant Output Limit (Toggle) | Toggle | — | Enable or disable the plant output limit. When ON, the plant power is capped at the specified MWac value. When OFF, no limit is applied. | — |
| 4 | Power Plant Output Limit (Value) | Text Field | MWac | Maximum AC power output at the point of interconnection. Typically set to the contracted interconnection capacity. Power exceeding this limit is curtailed. | — |
| 5 | Enable Time Series Data | Checkbox | — | When enabled, allows import of time-varying output limit values instead of using a fixed limit. Useful for modeling variable curtailment schedules or grid dispatch constraints. | — |
| 6 | Enable Nighttime Disconnect | Checkbox | — | When enabled, the plant disconnects from the grid during nighttime hours (when irradiance is zero). Reduces transformer no-load losses during non-production periods. | — |
| 7 | Hide Full Plant Breakdown | Button | — | Toggles visibility of the plant breakdown summary table showing Block, Arrays, Row spacing, Module rating, MWdc, MWac, and DC:AC ratio for each block. | — |
Transformers & Transmission Lines
This section allows you to model the electrical path from the plant collection point to the energy meter. Add transformers and transmission lines sequentially to represent the actual interconnection topology. Each component contributes to the total interconnection losses.User Inputs (Transformers & Transmission Lines)
| # | Input | Type | Units | Description | Related Documentation |
|---|---|---|---|---|---|
| 8 | Add Component | Button | — | Click the + button to add a new transformer or transmission line to the interconnection path. Components are added between the Power Plant and Energy Meter. Click the × button on any component to remove it. | — |
Transformer Parameters
| # | Input | Type | Units | Description | Related Documentation |
|---|---|---|---|---|---|
| 9 | Rating | Text Field | MVA | Apparent power rating of the HV transformer. Should be sized appropriately for the plant capacity. | AC System Losses |
| 10 | Voltage | Text Field | kV | High-side voltage of the transformer. Typical values range from 69 kV to 500 kV depending on the interconnection voltage level. | — |
| 11 | No Load Loss | Text Field | % | Transformer core losses as a percentage of rated MVA. These losses occur whenever the transformer is energized, regardless of load. Also known as iron losses. | AC System Losses |
| 12 | Full Load Loss | Text Field | % | Transformer winding losses at full load as a percentage of rated MVA. Also known as copper losses. Scales with the square of the load. | AC System Losses |
| 13 | Total Full Load Loss | Display | % | Sum of No Load Loss and Full Load Loss. This is a read-only calculated value showing the total transformer loss at rated power. | — |
Transmission Line Parameters
| # | Input | Type | Units | Description | Related Documentation |
|---|---|---|---|---|---|
| 14 | Line Length | Text Field | km / mi | Total length of the transmission line from the plant substation to the point of interconnection. | AC System Losses |
| 15 | Resistance | Text Field | Ω/1000 ft | Conductor resistance per 1000 feet (304.8 m). Combined with line length to calculate total line resistance and resulting I²R losses. | AC System Losses |
| 16 | Conductors per Phase | Text Field | — | Number of parallel conductors per phase. Multiple conductors reduce effective resistance and increase current-carrying capacity. Common values are 1, 2, or 4 (bundled conductors). | — |