

Step 1 — Open the Chrome Developer Console
There are several ways to open the Developer Console, which is part of what makes it feel more confusing than it needs to be. Any of the options below will work.Option 1
Press the F12 key to open the Developer Console. On some laptops you may need to hold the Fn key to activate F12. This is the fastest and most common way to open the console.Option 2
Open the Chrome menu (the three dots in the upper-right corner of the browser), then go to More tools → Developer tools.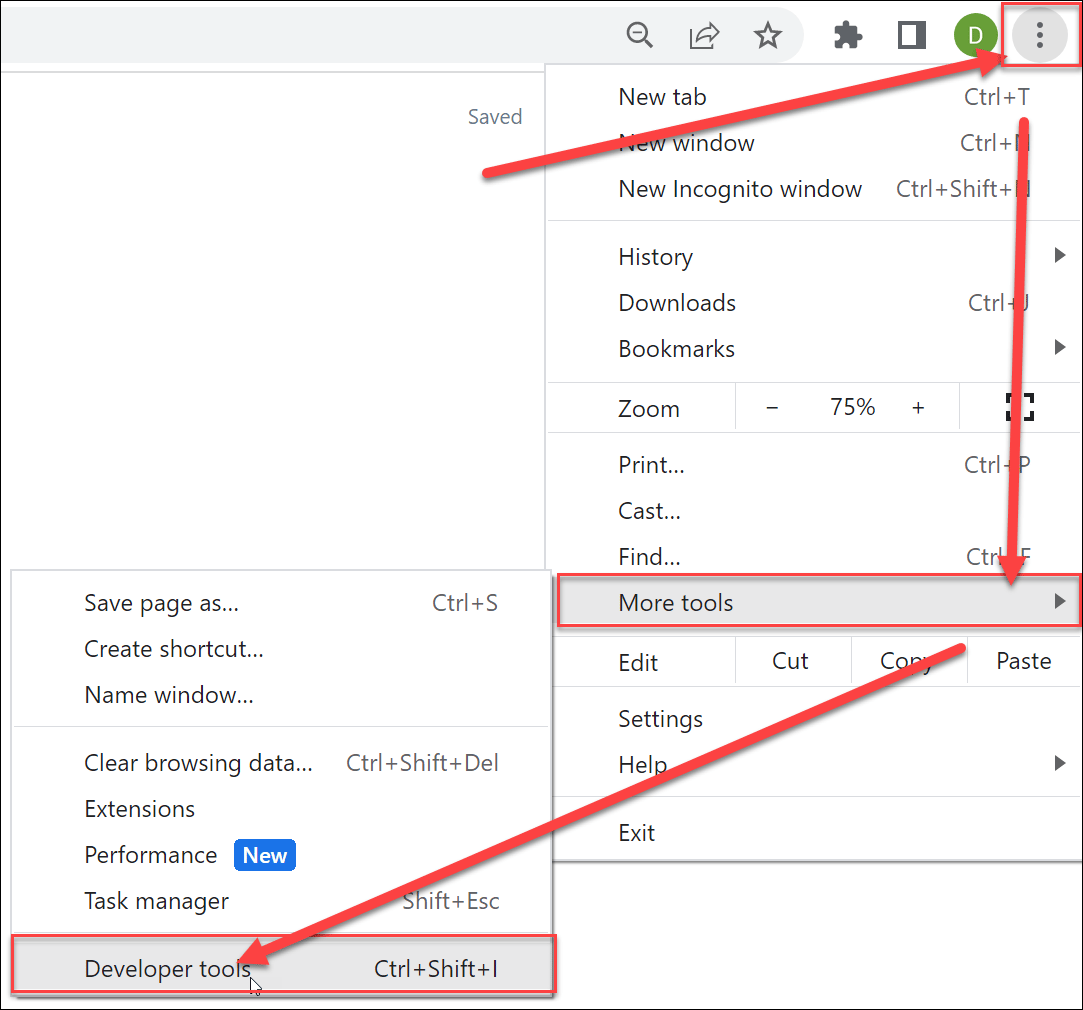
Navigating to Developer tools from the Chrome menu (More tools → Developer tools).
Option 3
You can also use the keyboard combination Ctrl + Shift + I. This is handy if your keyboard does not have an F12 key or if you prefer shortcut combinations.Step 2 — Empty the Cache and Hard Reload
With the Developer Console open, click and hold (or right-click) the page refresh icon in your Chrome browser. A menu will appear with three reload options.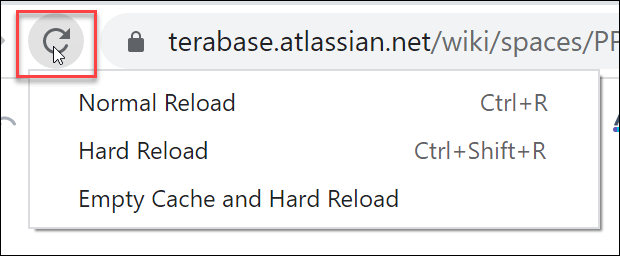
Click and hold the refresh icon to reveal the reload options.
Bonus — Use the Developer Console for Troubleshooting
The Developer Console is one of the handiest tools when working with PlantPredict. It shows a lot of information about what the application is doing, including errors that aren’t visible through the user interface.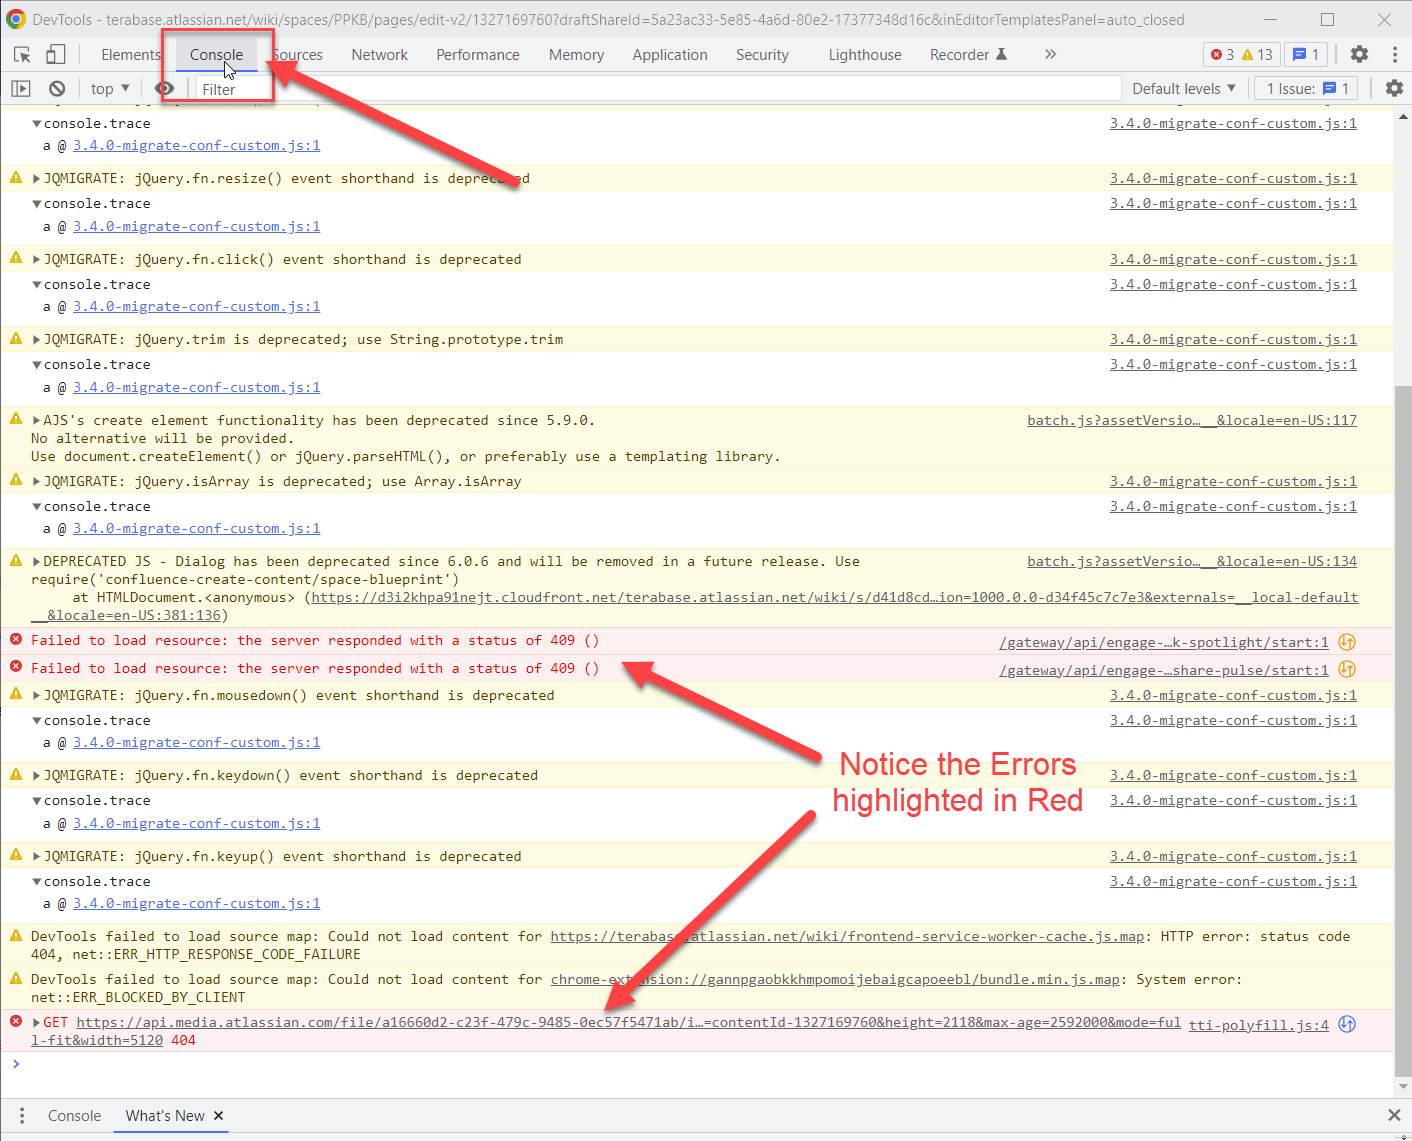
The Developer Console shows application activity, with errors highlighted in red.