A PlantPredict weather file contains time-series meteorological data required for energy predictions. Weather files are organized across three tabs for viewing summary statistics, interactive charts, and raw data.
Tab Overview
| Tab | Description |
|---|
| Summary | Annual totals, averages, station metadata, and data source information |
| Charts | Interactive time-series visualization of weather variables |
| Raw Data | Complete time-series data table with all weather parameters |
| Action | Description |
|---|
| Save Weather | Save changes to the weather file |
| Map | View the weather station location on a map |
| Change Status | Change the weather file status |
| Quality Check | Run data quality validation checks |
| Export | Export the weather file |
| Delete | Delete the weather file |
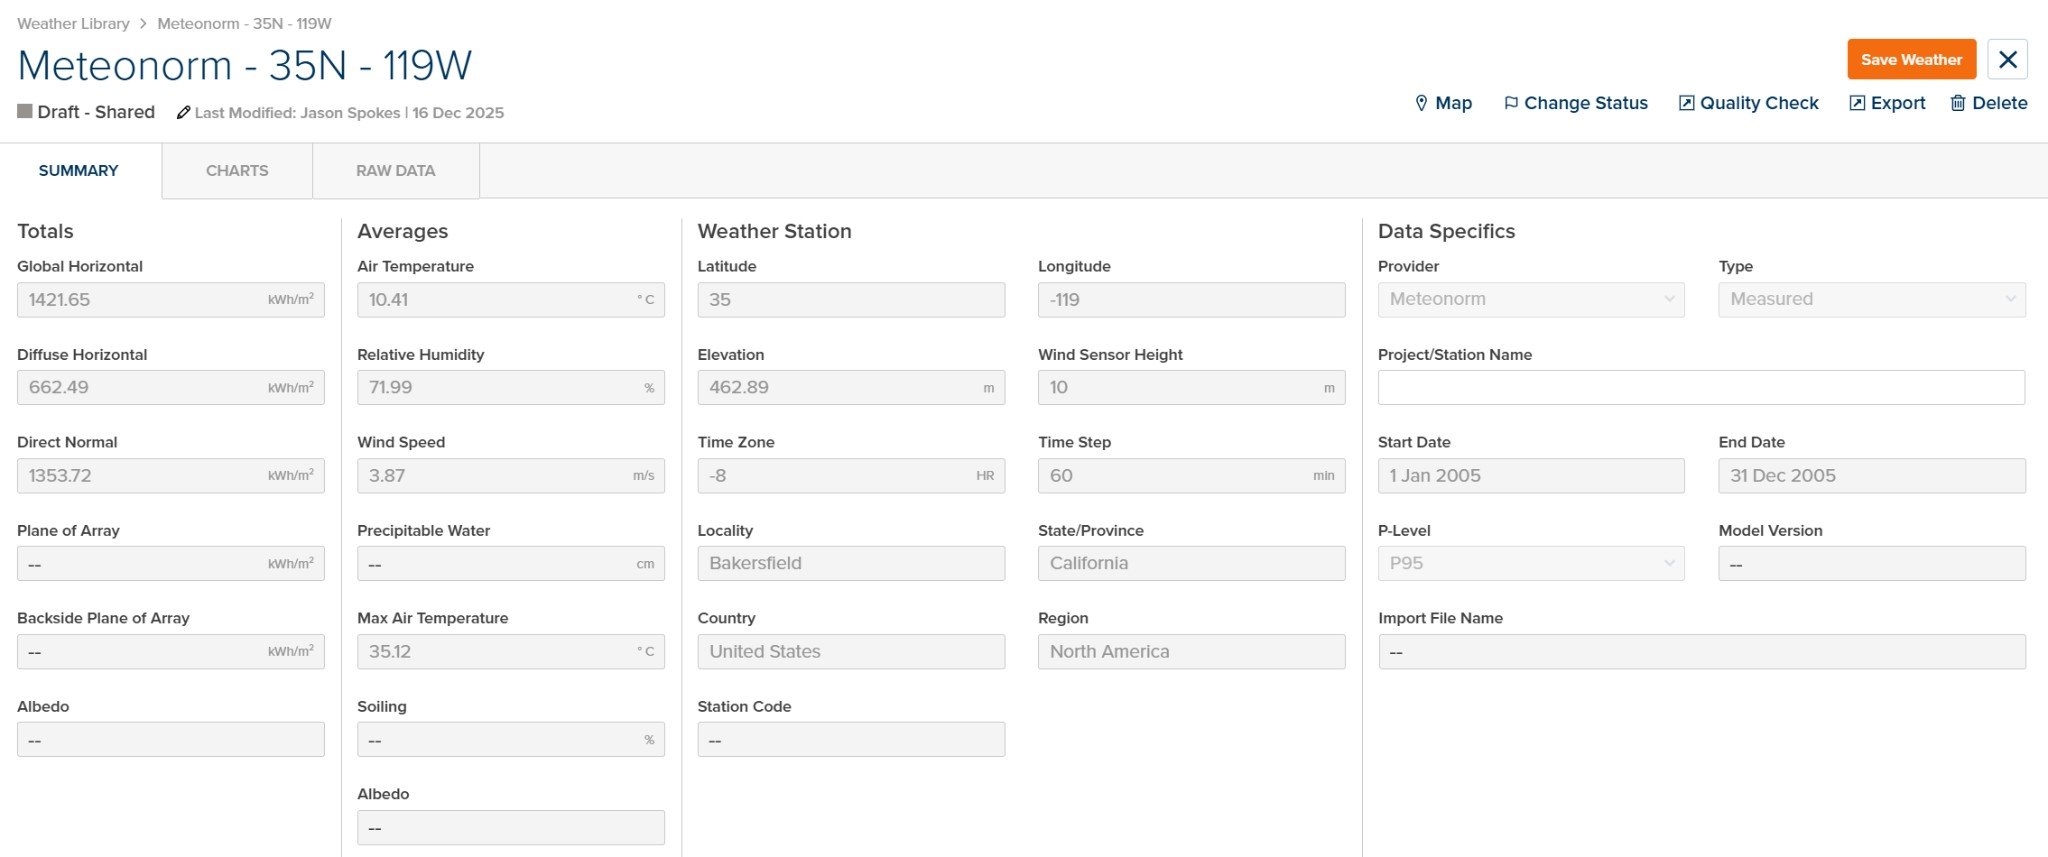
Summary Tab
The Summary tab displays aggregated statistics and metadata for the weather file.
Totals
Annual irradiance totals calculated from the time-series data.
| Parameter | Units | Description |
|---|
| Global Horizontal | kWh/m² | Total Global Horizontal Irradiance (GHI) |
| Diffuse Horizontal | kWh/m² | Total Diffuse Horizontal Irradiance (DHI) |
| Direct Normal | kWh/m² | Total Direct Normal Irradiance (DNI) |
| Plane of Array | kWh/m² | Total Plane of Array Irradiance (if available) |
| Backside Plane of Array | kWh/m² | Total rear-side irradiance for bifacial systems (if available) |
| Albedo | — | Average ground reflectance (if available) |
Averages
Annual average values for meteorological parameters.
| Parameter | Units | Description |
|---|
| Air Temperature | °C / °F | Average ambient air temperature |
| Relative Humidity | % | Average relative humidity |
| Wind Speed | m/s / ft/s | Average wind speed |
| Precipitable Water | cm / in | Average precipitable water in atmosphere |
| Max Air Temperature | °C / °F | Maximum recorded air temperature |
| Soiling | % | Average soiling loss (if available) |
| Albedo | — | Average ground albedo (if available) |
Weather Station
Location and metadata for the weather data source.
| Parameter | Units | Description |
|---|
| Latitude | ° | Station latitude (positive = North) |
| Longitude | ° | Station longitude (positive = East) |
| Elevation | m / ft | Station elevation above sea level |
| Time Zone | hr | UTC offset for timestamps |
| Time Step | min | Data interval (e.g., 60 = hourly) |
| Locality | — | City or locality name |
| State/Province | — | State or province |
| Country | — | Country |
| Region | — | Geographic region |
| Station Code | — | Weather station identifier (if applicable) |
Data Specifics
Information about the data source and file properties.
| Parameter | Units | Description |
|---|
| Provider | — | Weather data provider (e.g., Meteonorm, SolarAnywhere, NSRDB) |
| Type | — | Data type (Measured, Satellite-derived, TMY, etc.) |
| Project/Station Name | — | Name or identifier for the project or station |
| Start Date | — | First timestamp in the data |
| End Date | — | Last timestamp in the data |
| P-Level | — | Probability level (e.g., P50, P90, P95) |
| Model Version | — | Provider model version (if applicable) |
| Import File Name | — | Original filename when imported |
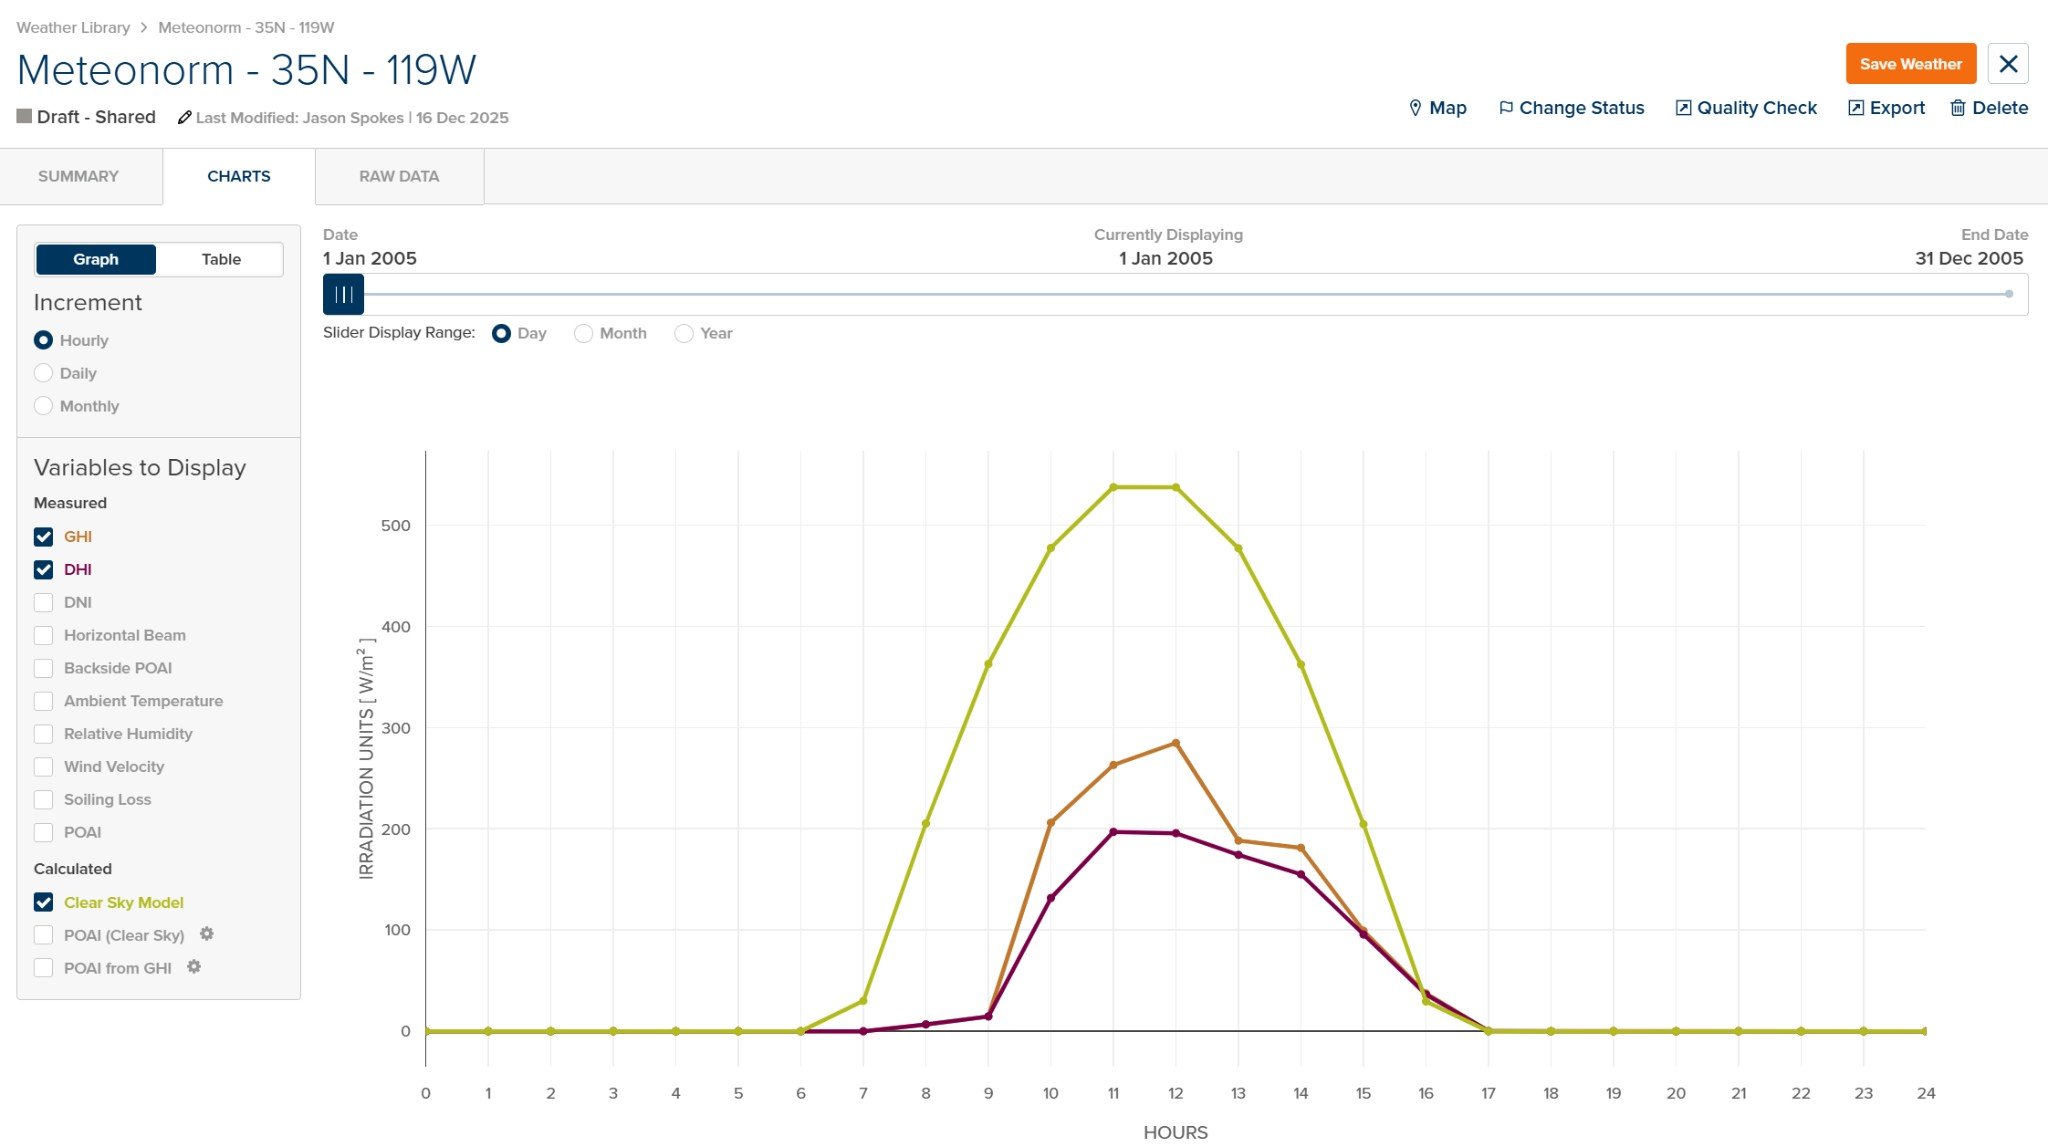
Charts Tab
The Charts tab provides interactive visualization of weather data time-series.
Display Options
| Element | Description |
|---|
| Graph / Table | Toggle between graphical chart and tabular data view |
| Date Range Slider | Adjust the displayed time range within the dataset |
| Slider Display Range | Select time scale: Day, Month, or Year |
Increment
Select the data aggregation level for display:
| Option | Description |
|---|
| Hourly | Display hourly data points |
| Daily | Aggregate and display daily values |
| Monthly | Aggregate and display monthly values |
Variables to Display
Measured Variables:
| Variable | Units | Description |
|---|
| GHI | W/m² | Global Horizontal Irradiance |
| DHI | W/m² | Diffuse Horizontal Irradiance |
| DNI | W/m² | Direct Normal Irradiance |
| Horizontal Beam | W/m² | Horizontal beam irradiance |
| Backside POAI | W/m² | Rear-side Plane of Array Irradiance |
| Ambient Temperature | °C / °F | Ambient air temperature |
| Relative Humidity | % | Relative humidity |
| Wind Velocity | m/s / ft/s | Wind speed |
| Soiling Loss | % | Soiling loss factor |
| POAI | W/m² | Plane of Array Irradiance |
| Variable | Units | Description |
|---|
| Clear Sky Model | W/m² | Calculated clear sky irradiance for comparison |
| POAI (Clear Sky) | W/m² | Clear sky Plane of Array Irradiance |
| POAI from GHI | W/m² | POA calculated from GHI using transposition models |
Use the Clear Sky Model overlay to identify potential data quality issues such as time shifts, sensor errors, or cloud enhancement events. Measured values significantly exceeding clear sky suggest data anomalies.
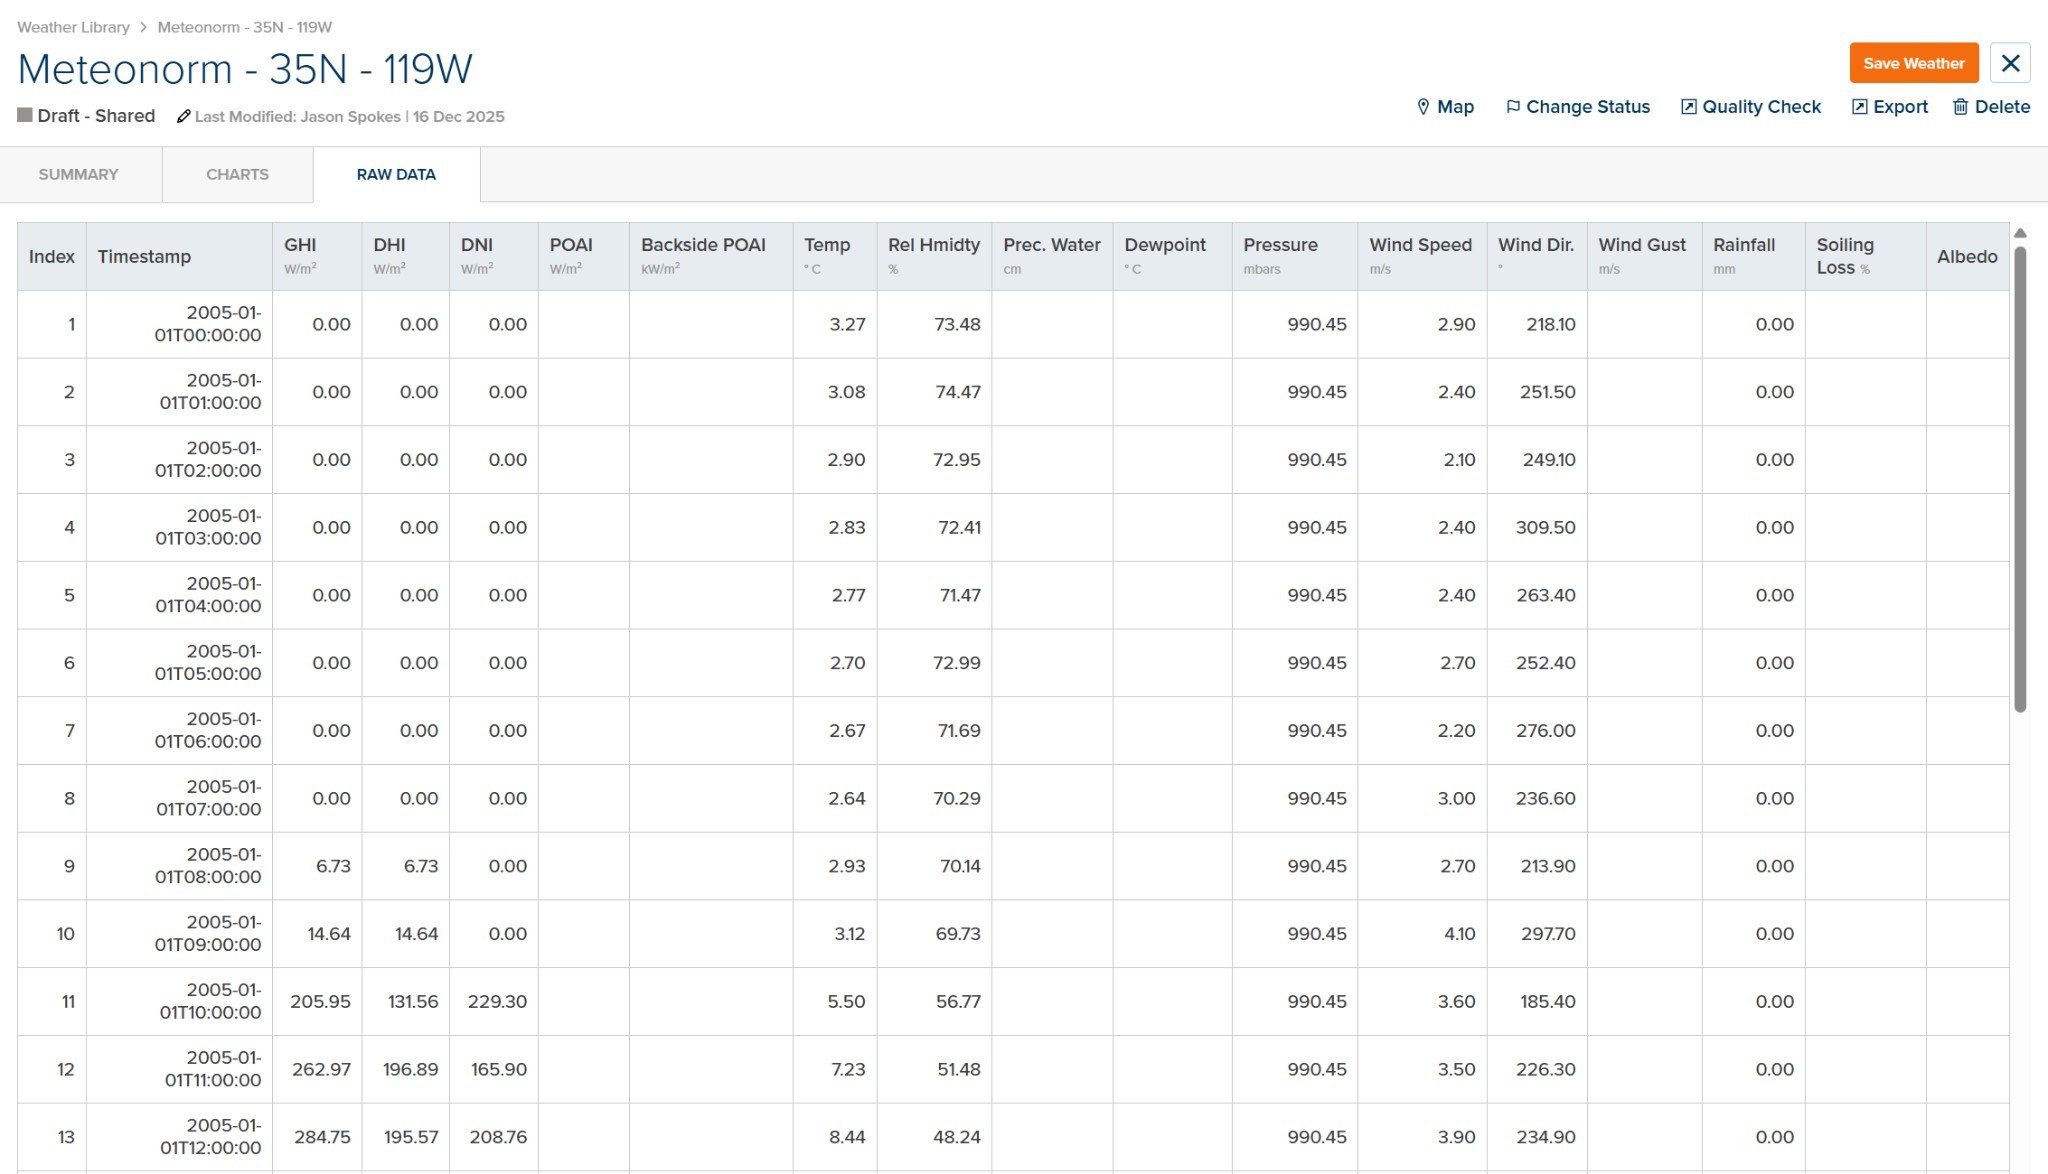
Raw Data Tab
The Raw Data tab displays the complete time-series data in tabular format.
Data Columns
| Column | Units | Description |
|---|
| Index | — | Row number |
| Timestamp | — | Date and time (ISO 8601 format) |
| GHI | W/m² | Global Horizontal Irradiance |
| DHI | W/m² | Diffuse Horizontal Irradiance |
| DNI | W/m² | Direct Normal Irradiance |
| POAI | kW/m² | Plane of Array Irradiance |
| Backside POAI | kW/m² | Rear-side Plane of Array Irradiance |
| Temp | °C / °F | Ambient temperature |
| Rel Hmdty | % | Relative humidity |
| Prec. Water | cm / in | Precipitable water |
| Dewpoint | °C / °F | Dewpoint temperature |
| Pressure | mbars | Atmospheric pressure |
| Wind Speed | m/s / ft/s | Wind speed |
| Wind Dir. | ° | Wind direction |
| Wind Gust | m/s / ft/s | Maximum wind gust |
| Rainfall | mm / in | Precipitation |
| Soiling Loss | % | Soiling loss factor |
| Albedo | — | Ground reflectance |
Not all columns will contain data for every weather file. Available parameters depend on the data source and provider. Columns without data will display as empty or with placeholder values.
Data Quality Considerations
When reviewing weather files, consider the following:
| Check | Description |
|---|
| GHI vs Clear Sky | GHI should not consistently exceed clear sky values |
| DHI + DNI ≈ GHI | Component irradiances should sum approximately to GHI |
| Time Alignment | Irradiance peaks should align with solar noon |
| Temperature Range | Temperatures should be reasonable for the location and season |
| Missing Data | Check for gaps or extended periods of zero values |
Use the Quality Check button in the header to run automated data validation checks on the weather file.