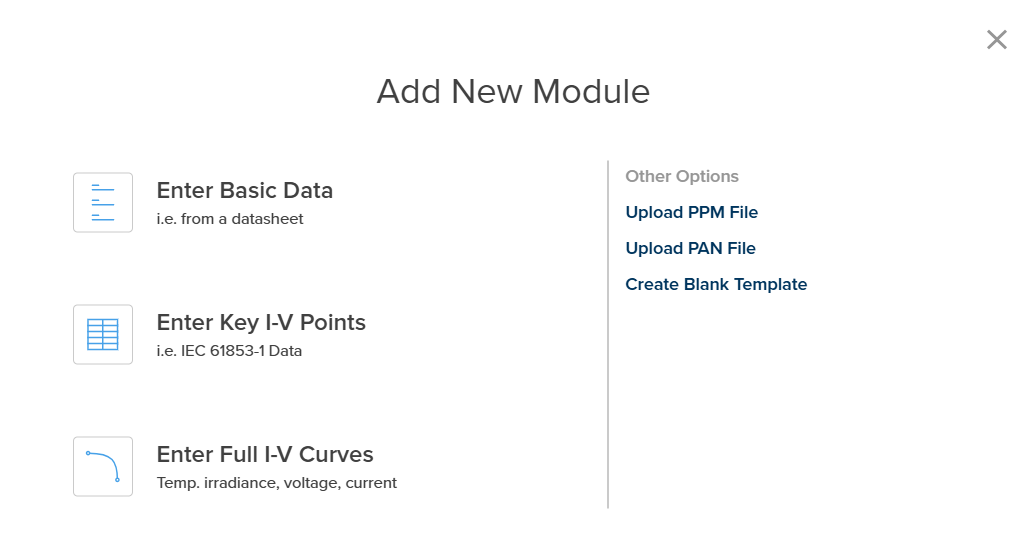
When you click Add New Module from the Module Library, a modal appears presenting six options for creating a new module specification.
| Option | Description | Best For |
|---|
| Enter Basic Data | Generate module from datasheet values | Standard module datasheets |
| Enter Key I-V Points | Generate from IEC 61853-1 performance data | Lab-tested performance data |
| Enter Full I-V Curves | Generate from complete I-V curve measurements | Detailed I-V curve data |
| Upload PPM File | Import PlantPredict native module file | Sharing between PlantPredict accounts |
| Upload PAN File | Import PVsyst native module file | Migration from PVsyst |
| Create Blank Template | Start with empty module file | Advanced users |
1. Upload PPM File
Upload a PlantPredict native module file (.ppm format). This is a straightforward file import:
- Click Upload PPM File
- A file explorer opens
- Navigate to and select your .ppm file
- The module is imported with all parameters intact
PPM files can be exported from any PlantPredict module using the Export button in the Module Library.
2. Upload PAN File
Upload a PVsyst native module file (.pan format). This allows migration of module specifications from PVsyst:
- Click Upload PAN File
- A file explorer opens
- Navigate to and select your .pan file
- PlantPredict converts the PVsyst parameters to PlantPredict format
Some PVsyst parameters may not have direct equivalents in PlantPredict. Review the imported module to ensure all critical parameters are correctly mapped.
3. Create Blank Template
Creates a new module file with all parameters set to default or empty values. This option provides the same parameter structure as documented in the Module File page.
- Click Create Blank Template
- A blank module file opens with all tabs available
- Manually enter all required parameters
- Click Save Module when complete
This option requires manual entry of all module parameters including 1-diode model coefficients. It is recommended only for advanced users who have complete module characterization data.
4. Enter Basic Data
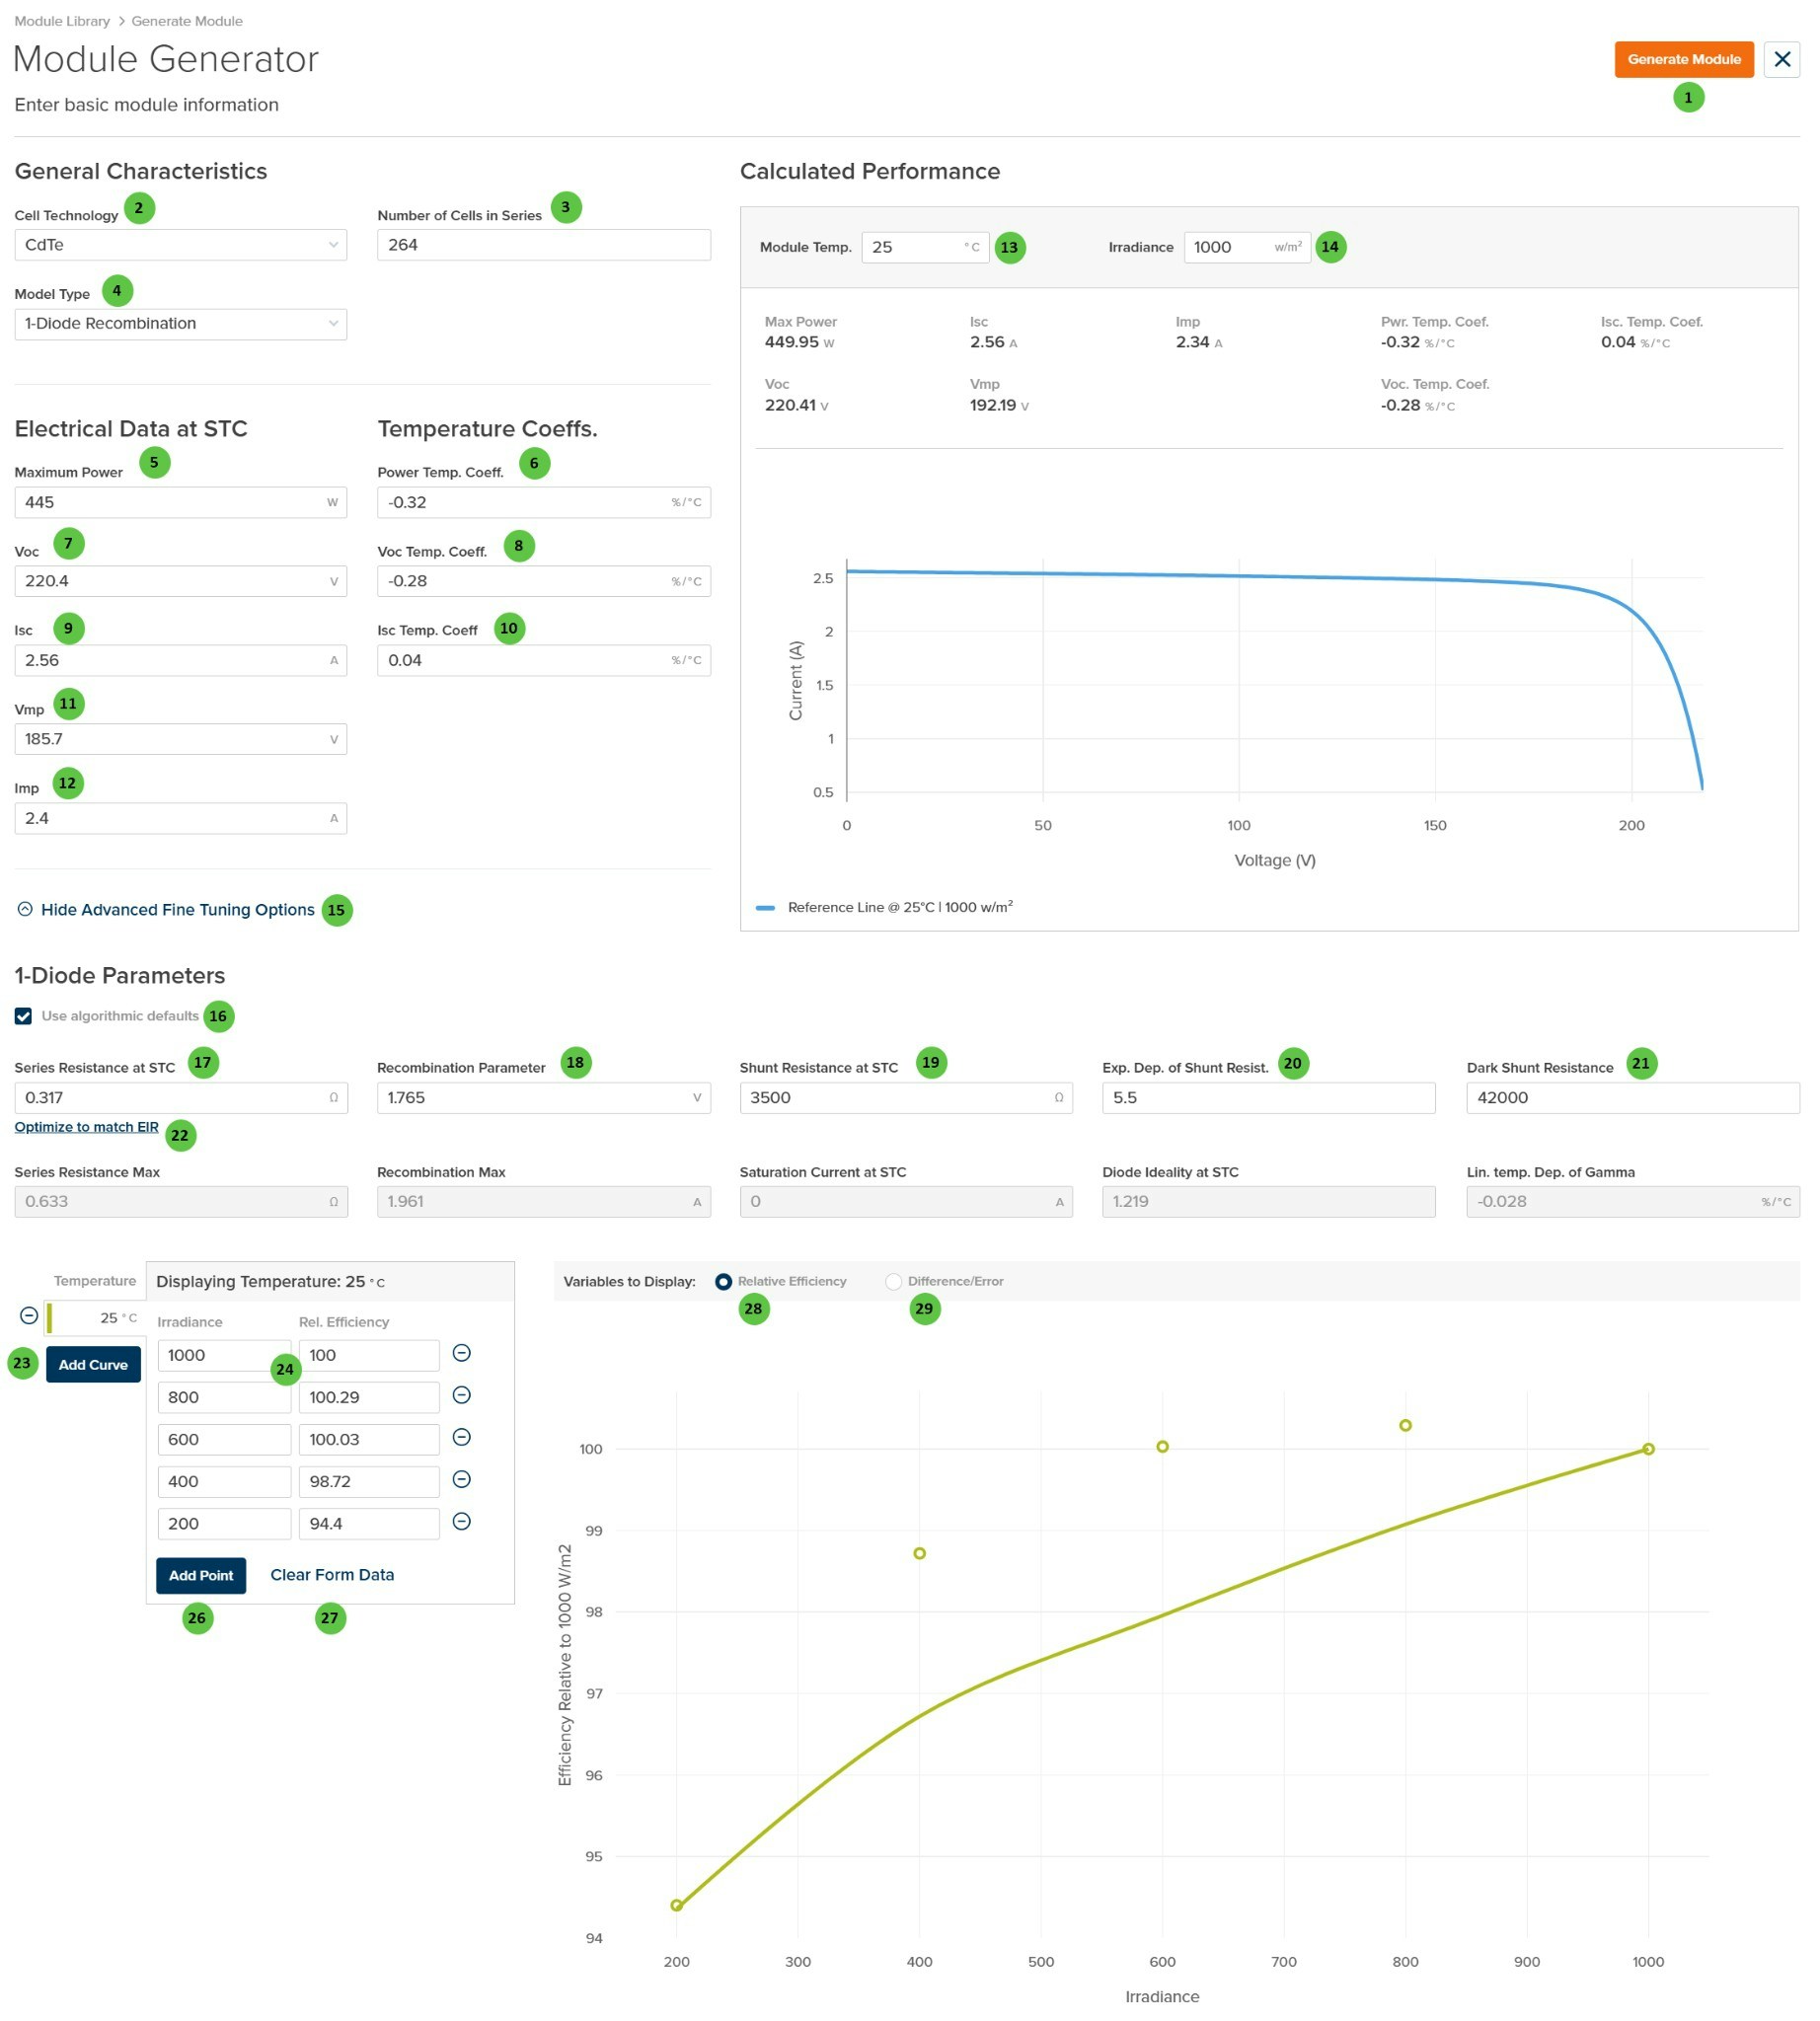
The Enter Basic Data option is recommended when creating a module from a standard manufacturer datasheet. PlantPredict automatically generates 1-diode parameters from the basic electrical characteristics you provide.
| # | Input | Type | Units | Description | Related Documentation |
|---|
| 1 | Generate Module | Button | — | Generates the complete module file from entered data and opens the module editor for final review and saving. | — |
| 2 | Cell Technology | Dropdown | — | Select the cell technology. Options: n-type mono c-Si, p-type mono c-Si PERC, p-type mono c-Si BSF, poly c-Si PERC, poly c-Si BSF, CdTe, CIGS, Mixed. | — |
| 3 | Number of Cells in Series | Numeric | — | Number of cells connected in series within the module. | — |
| 4 | Model Type | Dropdown | — | Select the diode model type. Options: 1-Diode, 1-Diode Recombination, 1-Diode Recombination Non-Linear. Use 1-Diode for crystalline silicon modules; use 1-Diode Recombination for CdTe modules. | Single Diode Model |
| 5 | Maximum Power | Numeric | W | Rated maximum power at STC (Pmax). | — |
| 6 | Power Temp. Coeff. | Numeric | %/°C | Temperature coefficient of power (typically negative). | — |
| 7 | Voc | Numeric | V | Open circuit voltage at STC. | — |
| 8 | Voc Temp. Coeff. | Numeric | %/°C | Temperature coefficient of open circuit voltage (typically negative). | — |
| 9 | Isc | Numeric | A | Short circuit current at STC. | — |
| 10 | Isc Temp. Coeff. | Numeric | %/°C | Temperature coefficient of short circuit current (typically positive). | — |
| 11 | Vmp | Numeric | V | Voltage at maximum power point at STC. | — |
| 12 | Imp | Numeric | A | Current at maximum power point at STC. | — |
| 13 | Module Temp. | Numeric | °C / °F | Temperature for calculated performance preview (adjustable). | — |
| 14 | Irradiance | Numeric | W/m² | Irradiance for calculated performance preview (adjustable). | — |
| 15 | Show/Hide Advanced Fine Tuning Options | Toggle | — | Expands or collapses the 1-Diode Parameters and Effective Irradiance Response (EIR) tuning sections. | — |
| 16 | Use algorithmic defaults | Checkbox | — | When checked, 1-diode parameters are calculated automatically. Unchecks automatically when any parameter is manually modified. Re-check to revert to defaults. | — |
| 17 | Series Resistance at STC | Numeric | Ω | Series resistance at STC. Key parameter for EIR optimization. | Single Diode Model |
| 18 | Recombination Parameter | Numeric | V | Recombination loss parameter for the diode model. | Recombination Model |
| 19 | Shunt Resistance at STC | Numeric | Ω | Shunt resistance at STC. | Single Diode Model |
| 20 | Exp. Dep. of Shunt Resist. | Numeric | — | Exponential dependence of shunt resistance on irradiance. | — |
| 21 | Dark Shunt Resistance | Numeric | Ω | Shunt resistance in the dark (zero irradiance). | — |
| 22 | Optimize to match EIR | Button | — | Algorithmically tunes Series Resistance at STC to match the desired Effective Irradiance Response curve. | — |
| 23 | Add Curve | Button | — | Add a new temperature curve for the Effective Irradiance Response. Only the 25°C curve is used for EIR optimization. | — |
| 24 | Irradiance / Rel. Efficiency Table | Table | W/m², % | Enter desired irradiance-relative efficiency pairs to define target EIR performance. | — |
| 26 | Add Point | Button | — | Add a new irradiance-efficiency data point to the EIR table. | — |
| 27 | Clear Form Data | Button | — | Clear all EIR data points from the table. | — |
| 28 | Relative Efficiency | Radio | — | Display the EIR chart showing relative efficiency vs. irradiance. Solid line = model-calculated; circles = target values. | — |
| 29 | Difference/Error | Radio | — | Display the difference between target and model-calculated relative efficiencies at each irradiance point. | — |
Workflow
- Fill in General Characteristics (Cell Technology, Number of Cells, Model Type)
- Enter Electrical Data at STC (Pmax, Voc, Isc, Vmp, Imp)
- Enter Temperature Coefficients (Power, Voc, Isc)
- Review the Calculated Performance and I-V curve preview
- (Optional) Expand Advanced Fine Tuning Options to optimize EIR
- Click Generate Module to create the module file
- Complete remaining metadata and click Save Module
Advanced Tuning with Effective Irradiance Response (EIR)
A module’s EIR defines its relative efficiency across a range of irradiance levels, where 100% represents efficiency at 1000 W/m².
To optimize EIR:
- Click Show Advanced Fine Tuning Options
- Click Add Curve and specify a temperature (use 25°C for optimization)
- Enter irradiance-relative efficiency pairs in the table
- The chart displays target values (circles) and model-calculated values (solid line)
- Click Optimize to match EIR to automatically tune Series Resistance
- Toggle to Difference/Error view to see optimization quality
- Manually adjust 1-diode parameters if further refinement is needed
The Optimize to match EIR feature currently only uses the 25°C curve for optimization. For best results, ensure your target EIR data is entered at this temperature.
5. Enter Key I-V Points
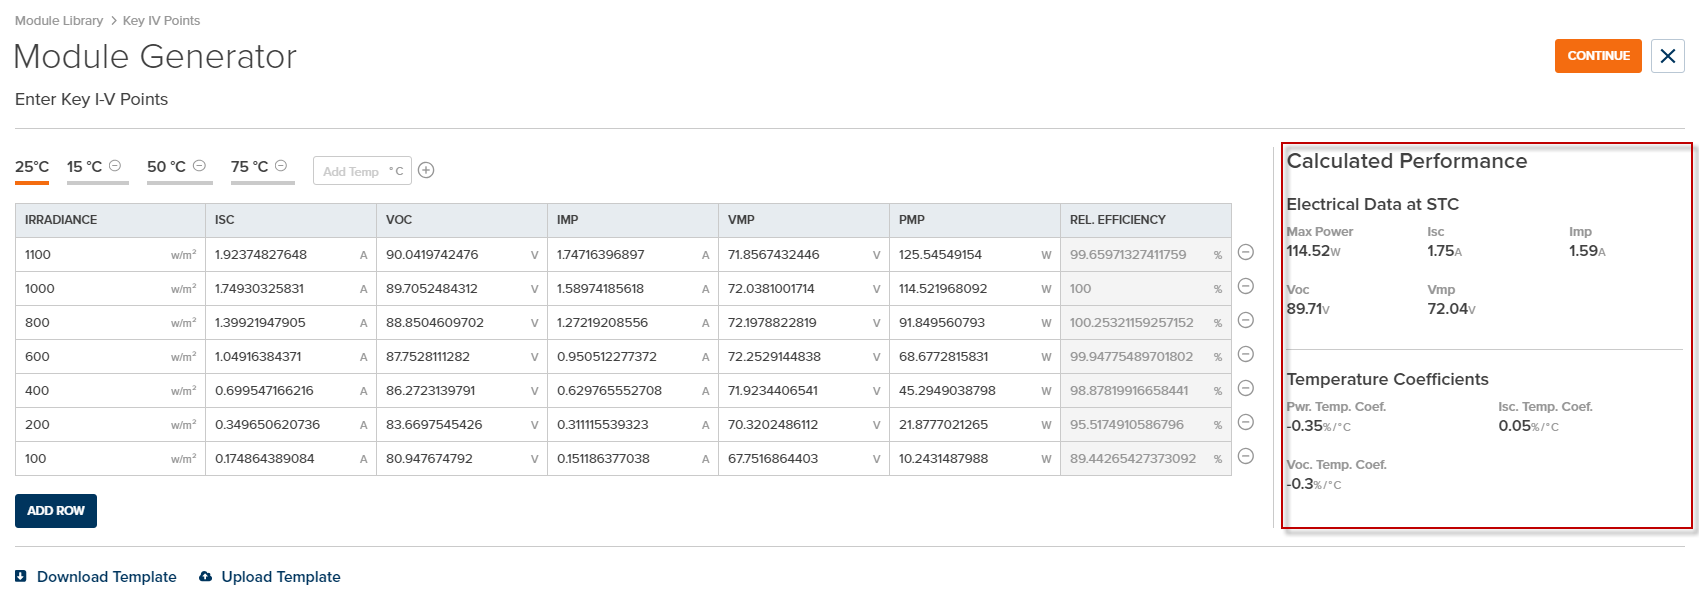
The Enter Key I-V Points option is recommended when you have module performance data from IEC 61853-1 testing or similar characterization. PlantPredict automatically calculates temperature coefficients and relative efficiencies from the provided data.
Data Entry Format
For each temperature and irradiance condition, enter the key electrical characteristics:
| Column | Units | Description |
|---|
| Irradiance | W/m² | Irradiance level for this data point |
| Isc | A | Short circuit current |
| Voc | V | Open circuit voltage |
| Imp | A | Current at maximum power point |
| Vmp | V | Voltage at maximum power point |
| Pmp | W | Maximum power (can be calculated) |
| Rel. Efficiency | % | Relative efficiency (auto-calculated when sufficient data provided) |
Features
| Element | Description |
|---|
| Temperature Tabs | Add data at multiple temperatures (25°C, 15°C, 50°C, 75°C, etc.) |
| Add Row | Add a new irradiance data point within the current temperature |
| Add Temp | Add a new temperature tab |
| Download Template | Download an Excel template for offline data entry |
| Upload Template | Upload a completed Excel template to populate the grid |
| Calculated Performance | Real-time display of extracted STC values and temperature coefficients |
| Continue | Proceed to the main module generator with pre-populated values |
Workflow
- Click Enter Key I-V Points from the Add New Module modal
- Enter data at 25°C, 1000 W/m² (minimum required)
- Add additional irradiance rows and temperature tabs as available
- Review the Calculated Performance panel for extracted values
- Click Continue to proceed to the module generator
- Review and finalize the module, then click Save Module
Minimum Requirement: At least one row of data at 25°C, 1000 W/m² is required. However, providing data at multiple temperatures and irradiances enables automatic calculation of temperature coefficients and relative efficiencies.
6. Enter Full I-V Curves
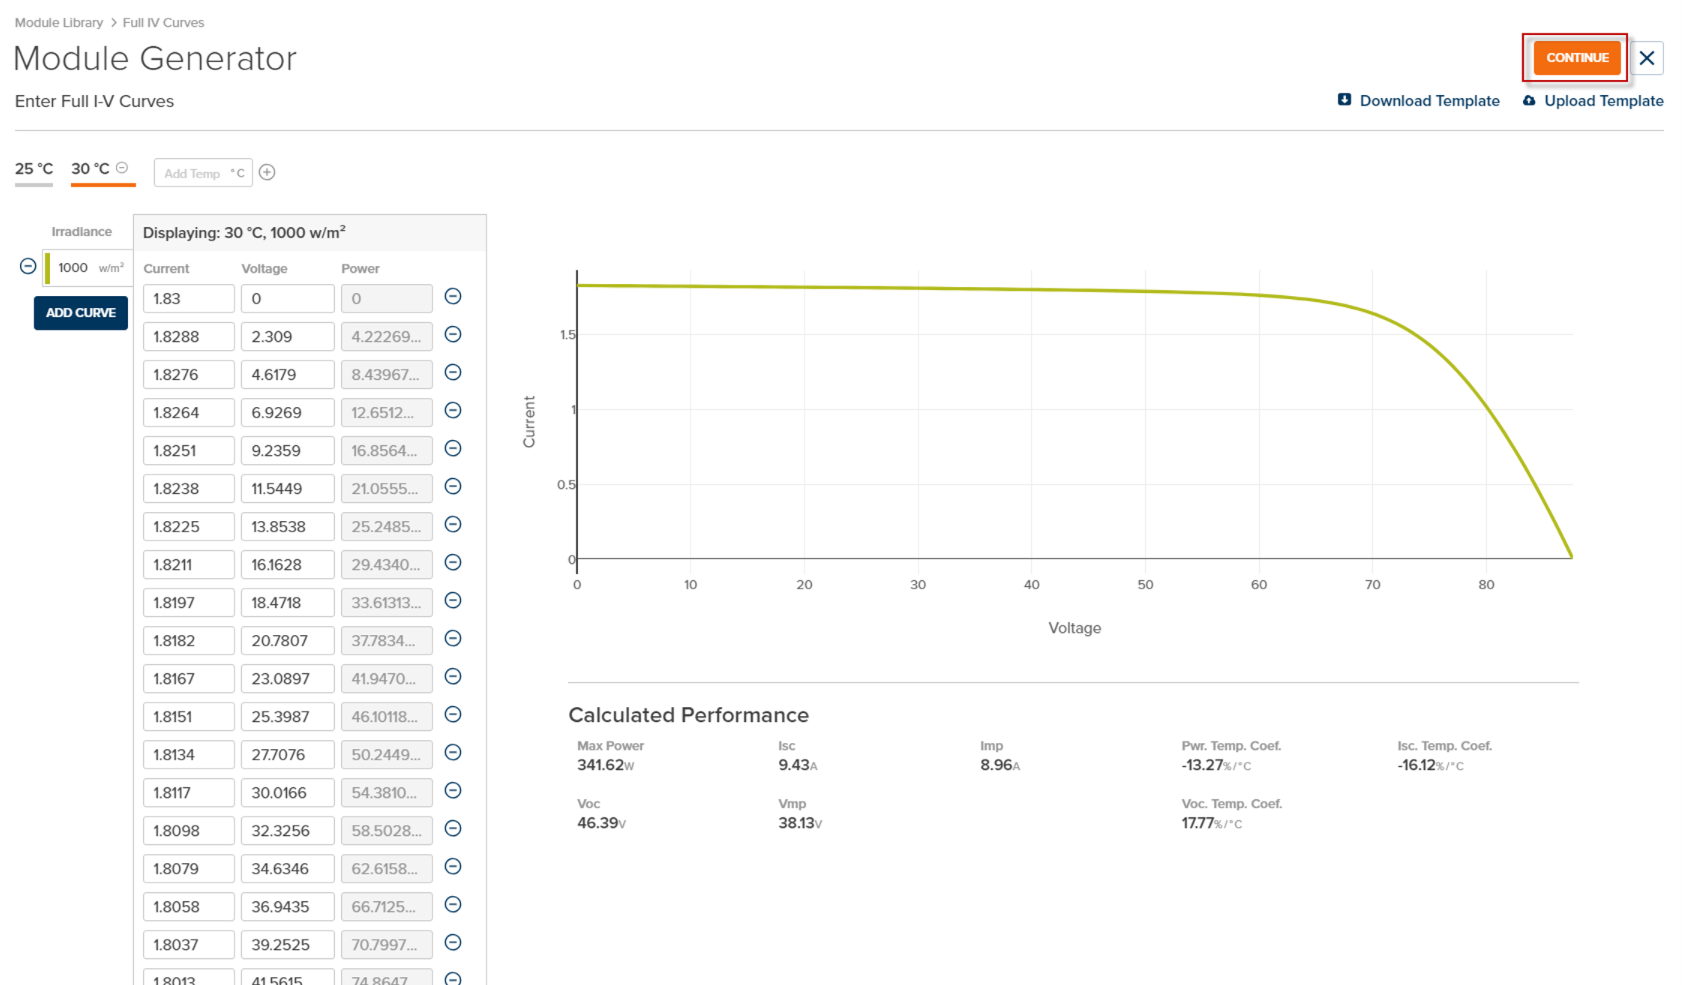
The Enter Full I-V Curves option is recommended when you have complete I-V curve measurements at STC and other conditions. PlantPredict extracts all key electrical parameters automatically from the curve data.
Data Entry Format
For each I-V curve, enter current-voltage pairs from Isc (V=0) to Voc (I=0):
| Column | Units | Description |
|---|
| Current | A | Current at each point on the I-V curve |
| Voltage | V | Voltage at each point on the I-V curve |
| Power | W | Calculated power at each point (auto-calculated) |
Features
| Element | Description |
|---|
| Temperature Tabs | Add curves at multiple temperatures (25°C, 30°C, etc.) |
| Irradiance Selector | Select or add irradiance levels for curves |
| Add Curve | Add a new I-V curve at a new irradiance within the current temperature |
| Add Temp | Add a new temperature tab |
| I-V Curve Chart | Real-time visualization of the entered curve |
| Download Template | Download an Excel template for offline data entry |
| Upload Template | Upload a completed Excel template to populate the grid |
| Calculated Performance | Real-time display of extracted STC values and temperature coefficients |
| Continue | Proceed to the main module generator with pre-populated values |
Workflow
- Click Enter Full I-V Curves from the Add New Module modal
- Enter the I-V curve at 25°C, 1000 W/m² (minimum required)
- Add additional curves at different irradiances and temperatures as available
- Review the Calculated Performance panel for extracted values
- Click Continue to proceed to the module generator
- Review and finalize the module, then click Save Module
Minimum Data Requirements:
- At least one I-V curve at 25°C, 1000 W/m²
- Each curve must contain at least 40 (I, V) data points
For easiest data entry with large datasets, use the Download Template option to get an Excel file, enter your data offline, then use Upload Template to populate the grid.