 ## Overview
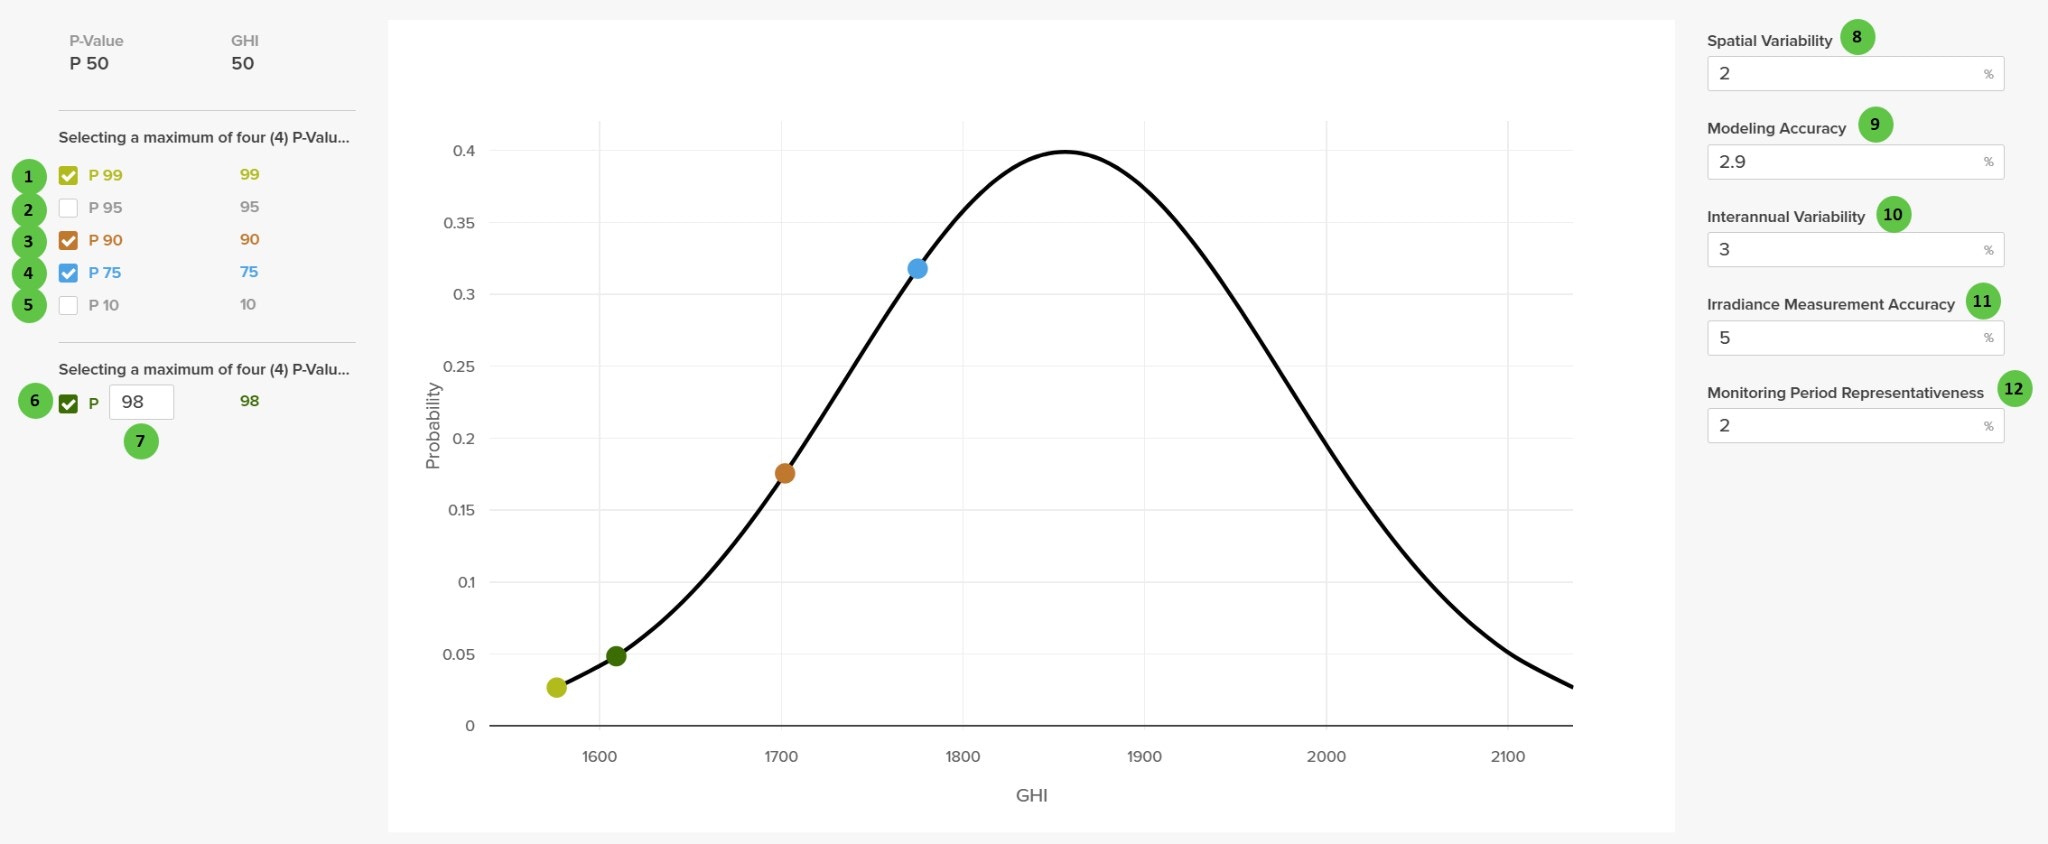
The Uncertainty Analysis page is organized into the following sections:
1. **P-Value Selection** — Choose which probability exceedance values to calculate (P99, P95, P90, P75, P10) plus a custom P-value option.
2. **Probability Distribution Chart** — Visual representation of the GHI probability distribution with selected P-values marked.
3. **Uncertainty Inputs** — Define the uncertainty percentages for various input parameters that contribute to the combined uncertainty.
***
## User Inputs (P-Value Selection)
## Overview
The Uncertainty Analysis page is organized into the following sections:
1. **P-Value Selection** — Choose which probability exceedance values to calculate (P99, P95, P90, P75, P10) plus a custom P-value option.
2. **Probability Distribution Chart** — Visual representation of the GHI probability distribution with selected P-values marked.
3. **Uncertainty Inputs** — Define the uncertainty percentages for various input parameters that contribute to the combined uncertainty.
***
## User Inputs (P-Value Selection)
| # | Input | Type | Units | Description | Related Documentation |
|---|---|---|---|---|---|
| **1** | **P 99** | Checkbox | — | Include P99 in results. P99 represents the energy value exceeded with 99% probability — a conservative estimate for financing scenarios. | [Uncertainty Analysis](/user-guide/results/uncertainty-analysis) |
| **2** | **P 95** | Checkbox | — | Include P95 in results. P95 represents the energy value exceeded with 95% probability. | [Uncertainty Analysis](/user-guide/results/uncertainty-analysis) |
| **3** | **P 90** | Checkbox | — | Include P90 in results. P90 represents the energy value exceeded with 90% probability — commonly used for debt sizing in project finance. | [Uncertainty Analysis](/user-guide/results/uncertainty-analysis) |
| **4** | **P 75** | Checkbox | — | Include P75 in results. P75 represents the energy value exceeded with 75% probability. | [Uncertainty Analysis](/user-guide/results/uncertainty-analysis) |
| **5** | **P 10** | Checkbox | — | Include P10 in results. P10 represents the energy value exceeded with 10% probability — an optimistic upside estimate. | [Uncertainty Analysis](/user-guide/results/uncertainty-analysis) |
| **6** | **Custom P** (Checkbox) | Checkbox | — | Enable a custom probability exceedance value. When checked, enter the desired P-value in the adjacent text field. | — |
| **7** | **Custom P** (Value) | Text Field | — | Enter a custom probability exceedance percentage (1-99). The corresponding energy value will be calculated and included in results. | — |
| # | Input | Type | Units | Description | Related Documentation |
|---|---|---|---|---|---|
| **8** | **Spatial Variability** | Text Field | % | Uncertainty due to differences between the weather data source location and the actual project site. Accounts for micro-climate variations and distance from measurement stations. | [Uncertainty Analysis](/user-guide/results/uncertainty-analysis) |
| **9** | **Modeling Accuracy** | Text Field | % | Uncertainty in the energy prediction model itself, including transposition, module performance, inverter efficiency, and loss calculations. | [Uncertainty Analysis](/user-guide/results/uncertainty-analysis) |
| **10** | **Interannual Variability** | Text Field | % | Year-to-year variation in solar resource at the site. Represents the natural fluctuation in annual irradiance from typical meteorological conditions. | [Uncertainty Analysis](/user-guide/results/uncertainty-analysis) |
| **11** | **Irradiance Measurement Accuracy** | Text Field | % | Uncertainty in the source irradiance data, including sensor calibration, data processing, and satellite-derived irradiance model accuracy. | [Uncertainty Analysis](/user-guide/results/uncertainty-analysis) |
| **12** | **Monitoring Period Representativeness** | Text Field | % | Uncertainty in how representative the weather data period is of long-term conditions. Shorter monitoring periods have higher uncertainty. | [Uncertainty Analysis](/user-guide/results/uncertainty-analysis) |