> ## Documentation Index
> Fetch the complete documentation index at: https://docs.plantpredict.com/llms.txt
> Use this file to discover all available pages before exploring further.
# Inverter File
> Complete reference for all parameters within a PlantPredict inverter file
A PlantPredict inverter file contains all electrical and performance parameters required to model inverter behavior. Inverter files are organized across four tabs, each containing related parameters.
## Tab Overview
| Tab | Description |
| ------------------------------------ | ----------------------------------------------------- |
| **Parameters** | General information and electrical ratings |
| **Efficiency** | Power-efficiency curves at multiple DC voltage levels |
| **Temperature & Elevation KVA** | Temperature-dependent power derating curves |
| **Active and Reactive Power Curves** | P-Q capability curves (experimental) |
***
## Parameters Tab
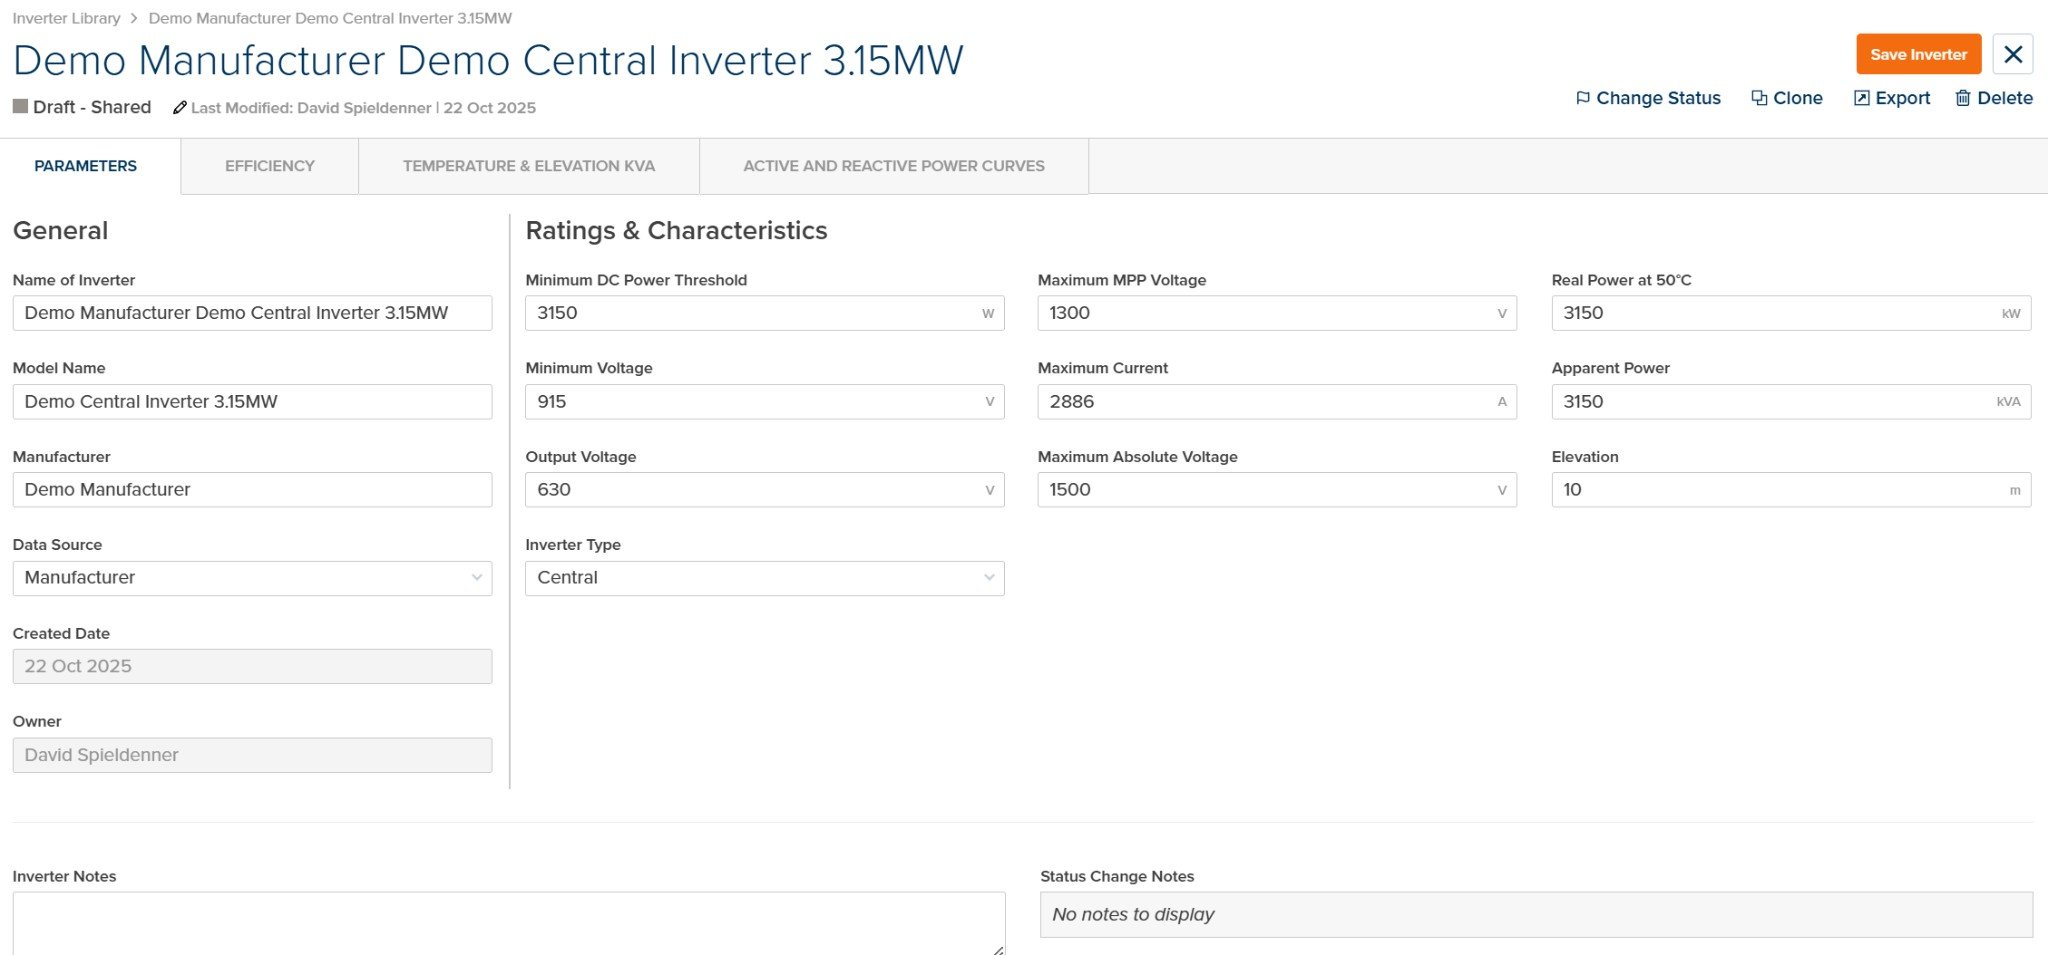
The Parameters tab contains general inverter information and electrical ratings.
 ### General
| Parameter | Units | Description |
| -------------------- | ----- | ------------------------------------------------------------------------------------------------------------------------------------------------------------------------- |
| **Name of Inverter** | — | Display name for the inverter in the library |
| **Model Name** | — | Manufacturer's model number or designation |
| **Manufacturer** | — | Name of the inverter manufacturer |
| **Data Source** | — | Source of the inverter specification data. Options: **Manufacturer**, **PVsyst**, **University of Geneva**, **Photon**, **Sandia Database**, **Custom**, **PlantPredict** |
| **Created Date** | — | Date the inverter file was created (read-only) |
| **Owner** | — | User who created or owns the inverter file (read-only) |
### Ratings & Characteristics
| Parameter | Units | Description |
| ------------------------------ | ------ | ------------------------------------------------------------------------------------------- |
| **Minimum DC Power Threshold** | W | Low-power cutoff threshold. Below this power level, the inverter shuts down. |
| **Minimum Voltage** | V | Lower MPPT voltage limit. The inverter cannot track maximum power point below this voltage. |
| **Output Voltage** | V | Nominal AC output voltage of the inverter. |
| **Inverter Type** | — | Inverter topology. Options: **Central**, **String**, **Unspecified** |
| **Maximum MPP Voltage** | V | Upper MPPT voltage limit. The inverter can track maximum power point up to this voltage. |
| **Maximum Current** | A | Maximum DC input current the inverter can accept. |
| **Maximum Absolute Voltage** | V | Absolute voltage limit. The inverter shuts down if voltage exceeds this threshold. |
| **Real Power at 50°C** | kW | Rated real power output at 50°C ambient temperature. |
| **Apparent Power** | kVA | Nameplate apparent power rating. |
| **Elevation** | m / ft | Reference elevation for the inverter ratings. |
### Notes
| Parameter | Units | Description |
| ----------------------- | ----- | ------------------------------------------------------------- |
| **Inverter Notes** | — | Free-form notes about the inverter specification. |
| **Status Change Notes** | — | Notes added when the inverter status was changed (read-only). |
See [Inverter Operating Regions](/models/inverter-models/inverter_operating_regions) for how voltage and power thresholds affect inverter behavior.
***
## Efficiency Tab
The Efficiency tab contains power-efficiency curves at multiple DC voltage levels. These curves define how efficiently the inverter converts DC power to AC power across its operating range.
### General
| Parameter | Units | Description |
| -------------------- | ----- | ------------------------------------------------------------------------------------------------------------------------------------------------------------------------- |
| **Name of Inverter** | — | Display name for the inverter in the library |
| **Model Name** | — | Manufacturer's model number or designation |
| **Manufacturer** | — | Name of the inverter manufacturer |
| **Data Source** | — | Source of the inverter specification data. Options: **Manufacturer**, **PVsyst**, **University of Geneva**, **Photon**, **Sandia Database**, **Custom**, **PlantPredict** |
| **Created Date** | — | Date the inverter file was created (read-only) |
| **Owner** | — | User who created or owns the inverter file (read-only) |
### Ratings & Characteristics
| Parameter | Units | Description |
| ------------------------------ | ------ | ------------------------------------------------------------------------------------------- |
| **Minimum DC Power Threshold** | W | Low-power cutoff threshold. Below this power level, the inverter shuts down. |
| **Minimum Voltage** | V | Lower MPPT voltage limit. The inverter cannot track maximum power point below this voltage. |
| **Output Voltage** | V | Nominal AC output voltage of the inverter. |
| **Inverter Type** | — | Inverter topology. Options: **Central**, **String**, **Unspecified** |
| **Maximum MPP Voltage** | V | Upper MPPT voltage limit. The inverter can track maximum power point up to this voltage. |
| **Maximum Current** | A | Maximum DC input current the inverter can accept. |
| **Maximum Absolute Voltage** | V | Absolute voltage limit. The inverter shuts down if voltage exceeds this threshold. |
| **Real Power at 50°C** | kW | Rated real power output at 50°C ambient temperature. |
| **Apparent Power** | kVA | Nameplate apparent power rating. |
| **Elevation** | m / ft | Reference elevation for the inverter ratings. |
### Notes
| Parameter | Units | Description |
| ----------------------- | ----- | ------------------------------------------------------------- |
| **Inverter Notes** | — | Free-form notes about the inverter specification. |
| **Status Change Notes** | — | Notes added when the inverter status was changed (read-only). |
See [Inverter Operating Regions](/models/inverter-models/inverter_operating_regions) for how voltage and power thresholds affect inverter behavior.
***
## Efficiency Tab
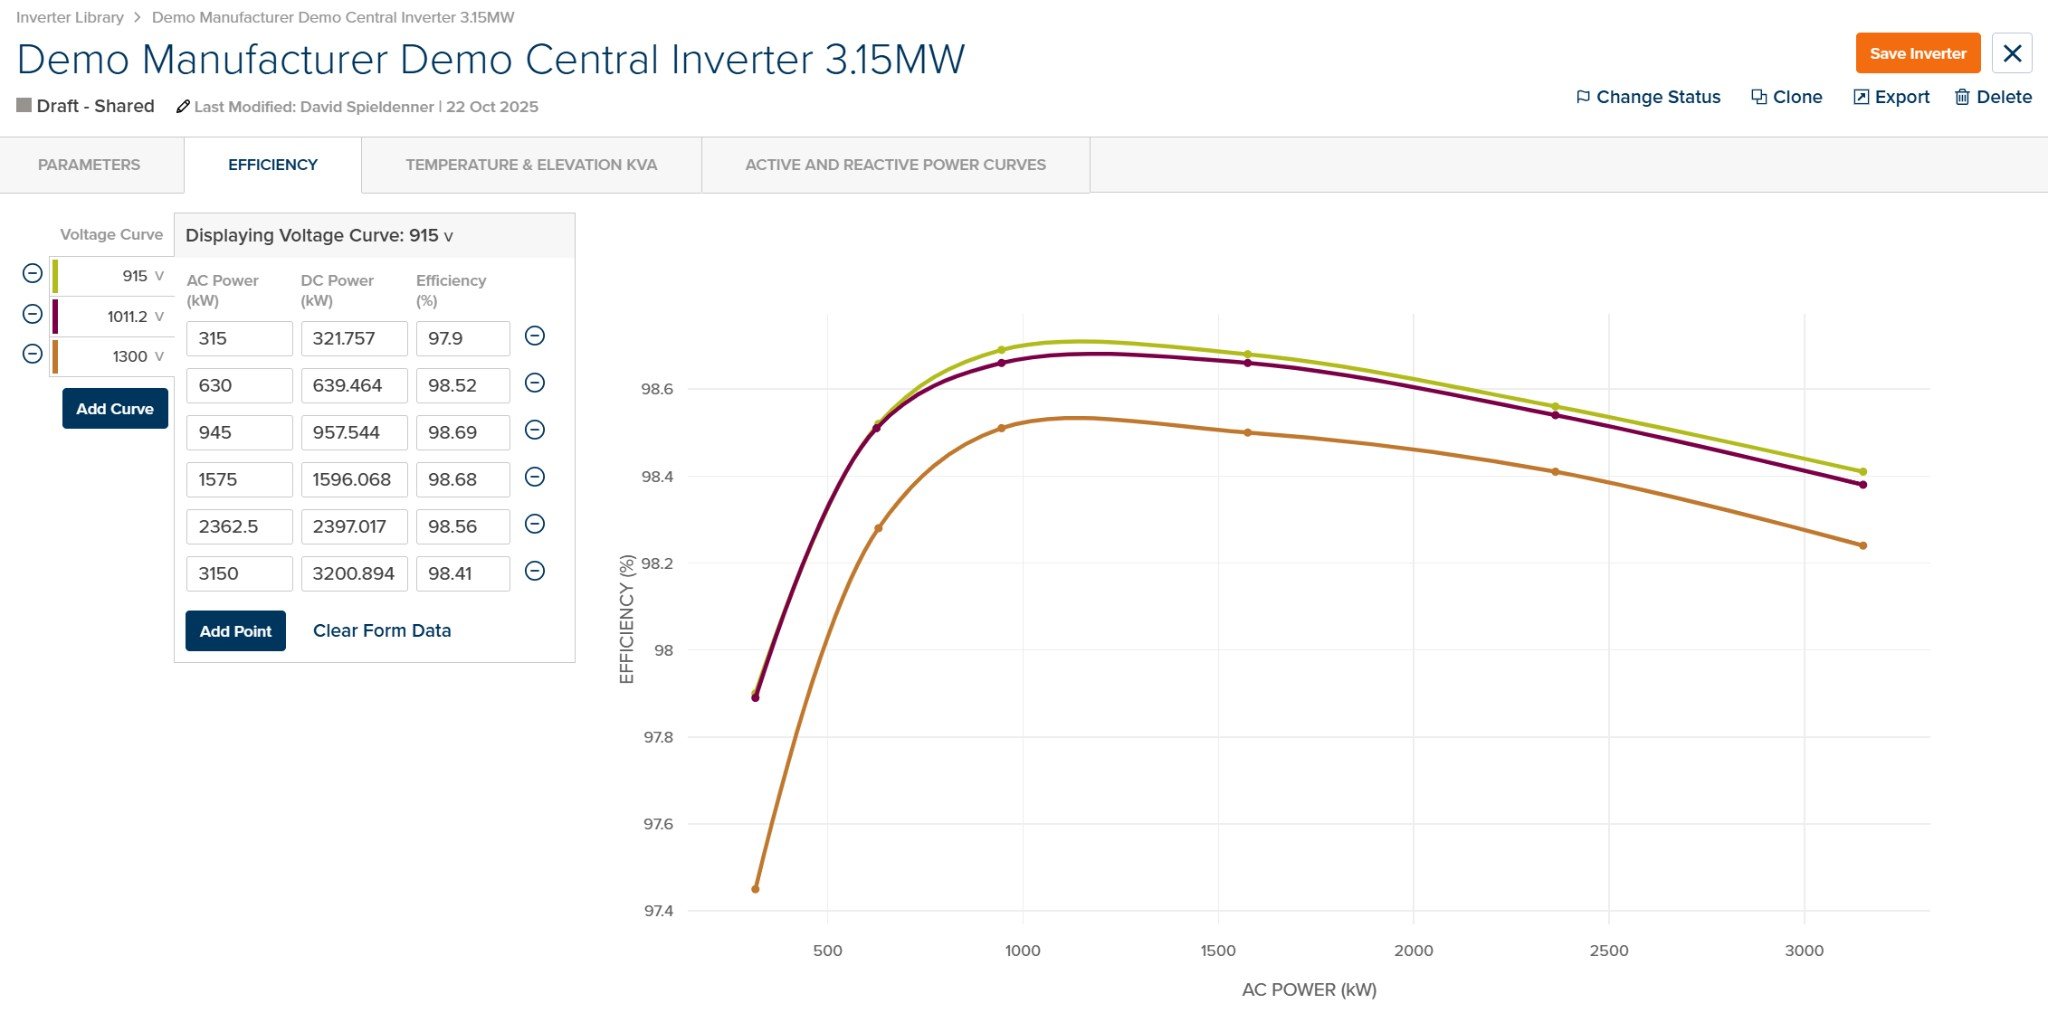
The Efficiency tab contains power-efficiency curves at multiple DC voltage levels. These curves define how efficiently the inverter converts DC power to AC power across its operating range.
 ### Voltage Curves
Efficiency curves are defined at multiple DC voltage levels (typically minimum, nominal, and maximum MPPT voltage). Each curve contains power-efficiency pairs.
| Element | Description |
| -------------------------- | --------------------------------------------------------- |
| **Voltage Curve Selector** | Select or add voltage curves (e.g., 915V, 1011.2V, 1300V) |
| **Add Curve** | Add a new efficiency curve at a different voltage level |
### Efficiency Data
| Column | Units | Description |
| -------------- | ----- | -------------------------------------------------------- |
| **AC Power** | kW | AC power output level |
| **DC Power** | kW | DC power input (calculated from AC power and efficiency) |
| **Efficiency** | % | Conversion efficiency at this operating point |
| Element | Description |
| ------------------- | ---------------------------------------------------------- |
| **Add Point** | Add a new power-efficiency data point to the current curve |
| **Clear Form Data** | Clear all data points from the current curve |
### Efficiency Chart
The chart displays efficiency (%) vs. AC Power (kW) for all voltage curves. Different colors represent different voltage levels, allowing visual comparison of efficiency across the operating range.
PlantPredict requires a minimum of 3 efficiency curves (at different voltage levels) for proper interpolation. Efficiency values typically range from 97-99% for modern inverters at optimal operating points.
See [Inverter Efficiency Models](/models/inverter-models/inverter_efficiency) for detailed algorithm documentation.
***
## Temperature & Elevation KVA Tab
The Temperature & Elevation KVA tab defines temperature-dependent power derating curves. When enabled, the inverter's AC power capacity is reduced when ambient temperature exceeds nominal conditions.
### Voltage Curves
Efficiency curves are defined at multiple DC voltage levels (typically minimum, nominal, and maximum MPPT voltage). Each curve contains power-efficiency pairs.
| Element | Description |
| -------------------------- | --------------------------------------------------------- |
| **Voltage Curve Selector** | Select or add voltage curves (e.g., 915V, 1011.2V, 1300V) |
| **Add Curve** | Add a new efficiency curve at a different voltage level |
### Efficiency Data
| Column | Units | Description |
| -------------- | ----- | -------------------------------------------------------- |
| **AC Power** | kW | AC power output level |
| **DC Power** | kW | DC power input (calculated from AC power and efficiency) |
| **Efficiency** | % | Conversion efficiency at this operating point |
| Element | Description |
| ------------------- | ---------------------------------------------------------- |
| **Add Point** | Add a new power-efficiency data point to the current curve |
| **Clear Form Data** | Clear all data points from the current curve |
### Efficiency Chart
The chart displays efficiency (%) vs. AC Power (kW) for all voltage curves. Different colors represent different voltage levels, allowing visual comparison of efficiency across the operating range.
PlantPredict requires a minimum of 3 efficiency curves (at different voltage levels) for proper interpolation. Efficiency values typically range from 97-99% for modern inverters at optimal operating points.
See [Inverter Efficiency Models](/models/inverter-models/inverter_efficiency) for detailed algorithm documentation.
***
## Temperature & Elevation KVA Tab
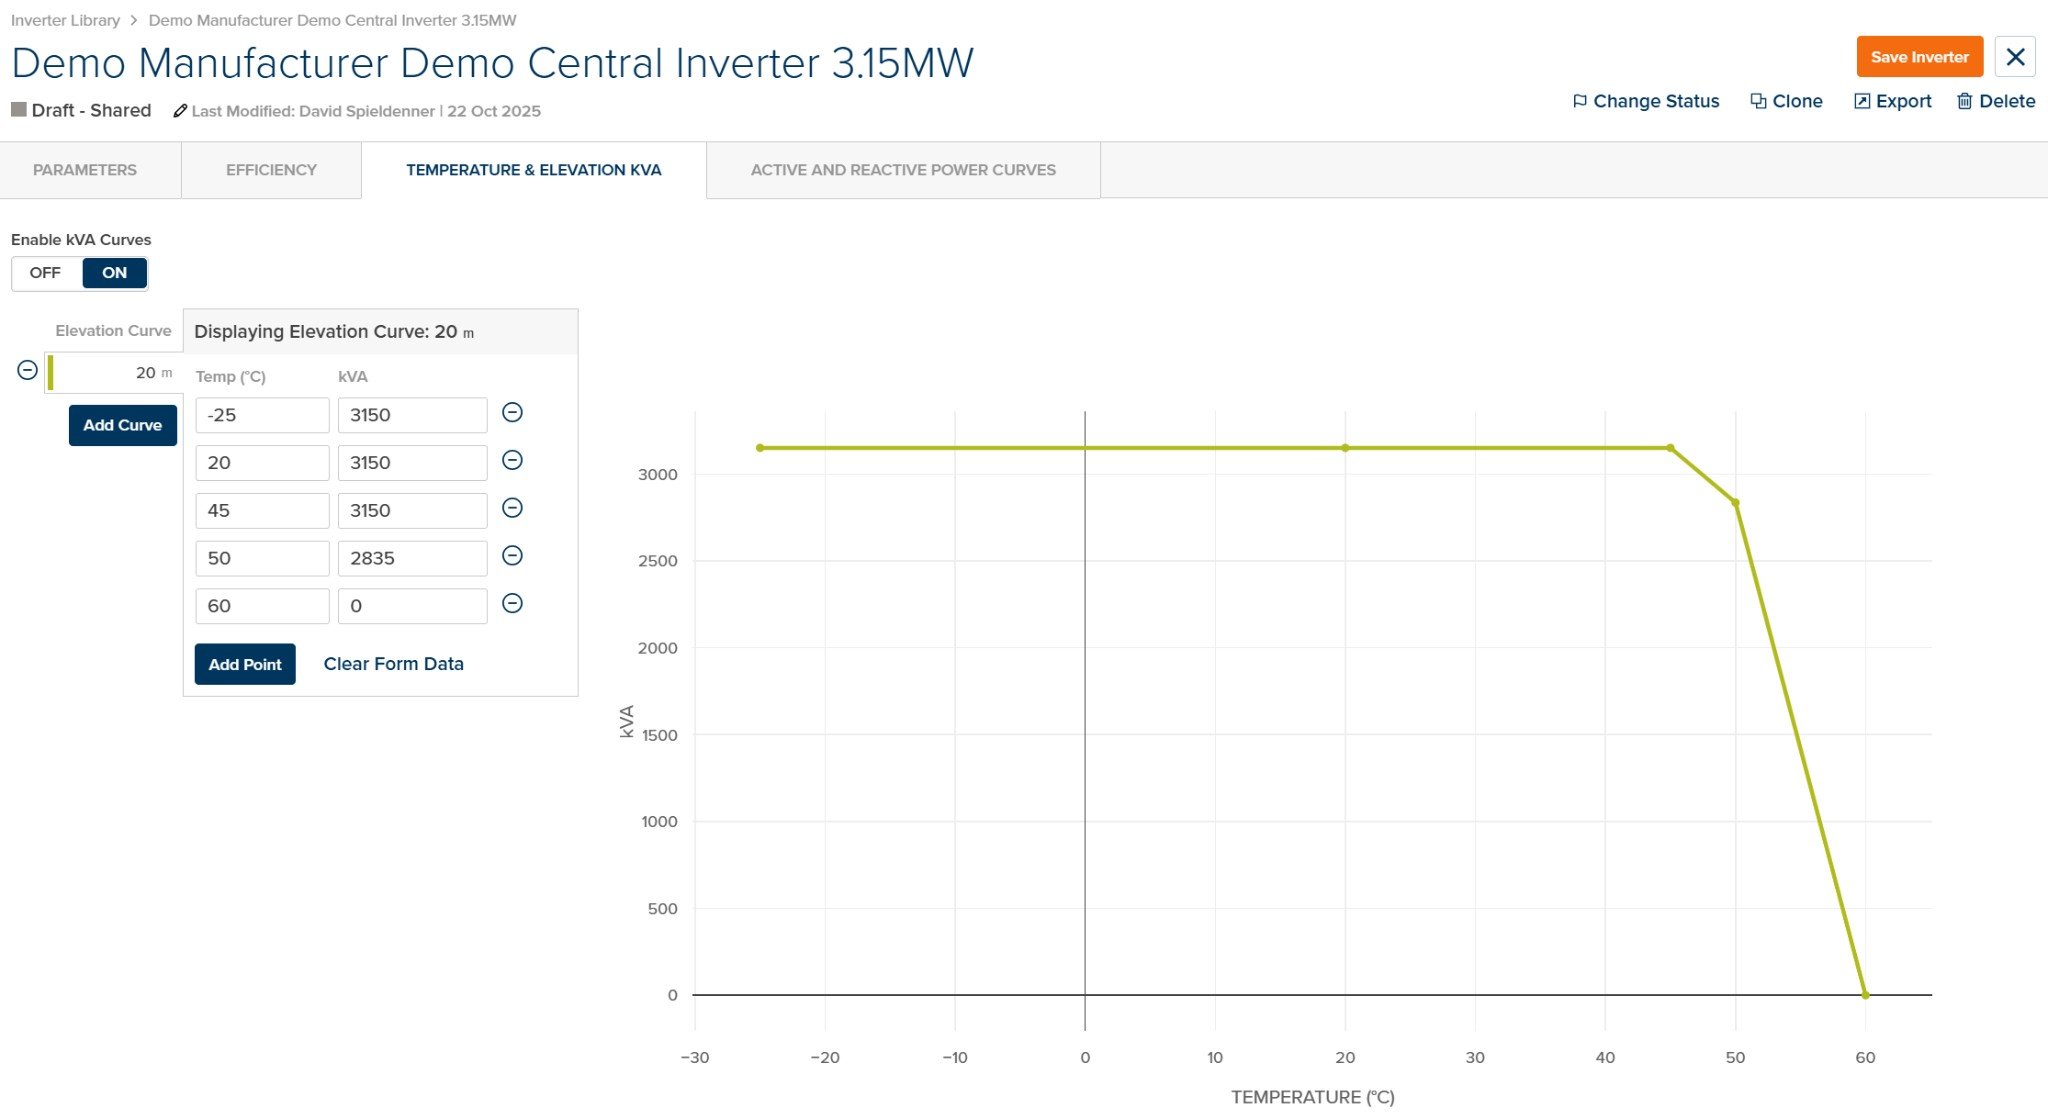
The Temperature & Elevation KVA tab defines temperature-dependent power derating curves. When enabled, the inverter's AC power capacity is reduced when ambient temperature exceeds nominal conditions.
 ### Enable/Disable
| Element | Description |
| --------------------- | --------------------------------------------------------------------------------------------------------------------------------------- |
| **Enable kVA Curves** | Toggle ON/OFF to enable or disable temperature derating. When OFF, the inverter operates at full rated power regardless of temperature. |
### Elevation Curves
Temperature-kVA curves can be defined at multiple elevation levels. PlantPredict selects the appropriate curve based on the site elevation.
| Element | Description |
| ---------------------------- | -------------------------------------------------------- |
| **Elevation Curve Selector** | Select or add elevation curves (e.g., 20m, 1000m, 2000m) |
| **Add Curve** | Add a new derating curve at a different elevation |
### Temperature-kVA Data
| Column | Units | Description |
| -------- | ------- | --------------------------------------------------- |
| **Temp** | °C / °F | Ambient temperature |
| **kVA** | kVA | Derated apparent power capacity at this temperature |
| Element | Description |
| ------------------- | --------------------------------------------------------- |
| **Add Point** | Add a new temperature-kVA data point to the current curve |
| **Clear Form Data** | Clear all data points from the current curve |
### Derating Chart
The chart displays kVA vs. Temperature (°C) showing how inverter capacity decreases at higher temperatures. The curve typically shows:
* Full capacity at low temperatures
* Gradual derating beginning around 45-50°C
* Zero capacity (shutdown) at the maximum operating temperature
If the ambient temperature exceeds the maximum temperature in the curve, the inverter is derated to zero (shutdown). Ensure your curves cover the full expected temperature range for your project location.
See [Inverter Temperature Derating](/models/inverter-models/inverter_temperature_derating) for detailed algorithm documentation.
***
## Active and Reactive Power Curves Tab
**Experimental Feature — Not Currently Used in Predictions**
The Active and Reactive Power Curves tab is an experimental feature. P-Q capability curves defined in this tab are not currently used in PlantPredict energy predictions. This tab is reserved for future grid interaction modeling capabilities.
The Active and Reactive Power Curves tab allows definition of P-Q capability curves that specify the inverter's ability to provide reactive power support at various active power levels. These curves are typically used for detailed grid compliance studies.
### Enable/Disable
| Element | Description |
| --------------------- | --------------------------------------------------------------------------------------------------------------------------------------- |
| **Enable kVA Curves** | Toggle ON/OFF to enable or disable temperature derating. When OFF, the inverter operates at full rated power regardless of temperature. |
### Elevation Curves
Temperature-kVA curves can be defined at multiple elevation levels. PlantPredict selects the appropriate curve based on the site elevation.
| Element | Description |
| ---------------------------- | -------------------------------------------------------- |
| **Elevation Curve Selector** | Select or add elevation curves (e.g., 20m, 1000m, 2000m) |
| **Add Curve** | Add a new derating curve at a different elevation |
### Temperature-kVA Data
| Column | Units | Description |
| -------- | ------- | --------------------------------------------------- |
| **Temp** | °C / °F | Ambient temperature |
| **kVA** | kVA | Derated apparent power capacity at this temperature |
| Element | Description |
| ------------------- | --------------------------------------------------------- |
| **Add Point** | Add a new temperature-kVA data point to the current curve |
| **Clear Form Data** | Clear all data points from the current curve |
### Derating Chart
The chart displays kVA vs. Temperature (°C) showing how inverter capacity decreases at higher temperatures. The curve typically shows:
* Full capacity at low temperatures
* Gradual derating beginning around 45-50°C
* Zero capacity (shutdown) at the maximum operating temperature
If the ambient temperature exceeds the maximum temperature in the curve, the inverter is derated to zero (shutdown). Ensure your curves cover the full expected temperature range for your project location.
See [Inverter Temperature Derating](/models/inverter-models/inverter_temperature_derating) for detailed algorithm documentation.
***
## Active and Reactive Power Curves Tab
**Experimental Feature — Not Currently Used in Predictions**
The Active and Reactive Power Curves tab is an experimental feature. P-Q capability curves defined in this tab are not currently used in PlantPredict energy predictions. This tab is reserved for future grid interaction modeling capabilities.
The Active and Reactive Power Curves tab allows definition of P-Q capability curves that specify the inverter's ability to provide reactive power support at various active power levels. These curves are typically used for detailed grid compliance studies.